Overview
This report, the second in a three-part series, employs a novel empirical approach to systematically assess the current operating status of known detention facilities in Xinjiang using nighttime lighting. This analysis provides new, empirical evidence to suggest that the overwhelming majority of detention facilities in Xinjiang remain active, operational, and in many cases, still under construction – despite Chinese claims to the contrary.
About This Series: A growing body of research has systematically documented China's efforts to imprison, detain, and re-educate ethnic Uyghur and minority groups throughout its western Xinjiang province. In this three-part investigation, RAND researchers explore new data on nighttime lighting in Xinjiang to offer new, empirical insights into China's efforts to reeducate, detain, and imprison its Uyghur and ethnic minority populations across Xinjiang.
Activity
GEOINT analysis of nighttime lighting and satellite imagery data is conducted to assess the likely operating status of 380 known detention facilities in Xinjiang. This analysis reveals little evidence to suggest that the systematic detention and reeducation of Uyghur and ethnic minority populations in Xinjiang has declined over time, despite official Chinese government claims to the contrary.
In the first report in this series, RAND introduced its approach to systematically and empirically diagnose the level of activity at Uyghur and ethnic minority detention facilities in Xinjiang using nighttime lighting data. Through analysis of these data, our first report offered new evidence of the explosive growth in detention facilities across Xinjiang as part of a consolidated, thirty-six-month campaign beginning in 2016 through early 2019.
As mounting evidence of China's efforts to detain, re-educate, and imprison Xinjiang's ethnic Uyghur and minority group population has grown in recent years, Chinese officials have variously denied the existence of these facilities, suggested that they serve only as benign vocational training centers, or that they are necessary to cure ideological diseases in those with problematic ideas sympathetic to radical causes. But since mid-2019, the Chinese government has frequently suggested that its widespread reeducation and forced labor practices in Xinjiang, while still benign in nature, have largely come to an end.
Therefore, in this second report, we use monthly data on nighttime lighting in Xinjiang to systematically assess the current operating status of 380 known detention facilities, originally geolocated by the Australian Strategic Policy Institute (ASPI). This analysis provides new, empirical evidence to suggest that the vast majority of detention facilities in Xinjiang remain active, operational, and in many cases, still under new construction – despite Chinese claims to the contrary. In so doing, this report affirms and amplifies other existing research to suggest that China's detention system in Xinjiang remains highly operational to this day.
Background
This research analyzes monthly nighttime lighting data over known detention facilities in Xinjiang, based off a dataset of 380 known or suspected facilities originally identified by ASPI. Using the locations of these facilities, we measure the average nighttime lighting over each facility on a monthly basis from 2014 through mid-2020, and identify major periods of uninterrupted growth or decline in nighttime lighting over time. Further details on this portion of our analysis are included in the first report in this series.
Figure One below plots the number of detention facilities in our dataset experiencing a major period of growth or decline in nighttime lighting, per month since January 2014. In a given month on this figure, each bar represents the number of distinct detention facilities experiencing an uninterrupted period of growth (blue) or decline (red) in smoothed nighttime lighting.
Figure One. Detention Facilities Experiencing Major Growth or Decline in Nighttime Lighting, 2014-2020
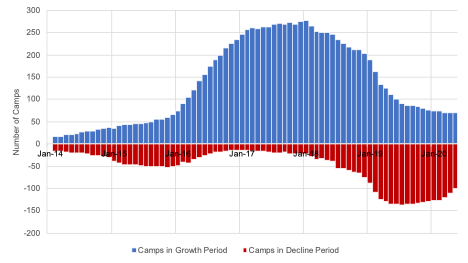
In our last report, we focused on understanding the massive expansion of detention facilities across Xinjiang, as shown in blue on this figure. In this report, we turn to focus on evidence of detention facilities experiencing major declines in nighttime lighting over time, as shown in red. Despite the massive growth in detention facilities across Xinjiang between 2016 and early 2019, our analysis suggests that roughly 100 facilities per month (on average) experienced sustained declines in nighttime lighting in more recent months, from early 2019 through mid-2020.
At face value, this correlates with official Chinese government claims to have ceased or relaxed its detention measures around this same period of time. But does a decline in nighttime lighting actually imply that these facilities have been closed and decommissioned? Or, does it simply suggest a reversion to ordinary levels of nighttime lighting for active facilities no longer under construction?
Methodology
To answer this question, we first examined the nighttime lighting trajectories of each individual detention facility in our dataset, looking for common trends that could help identify just those detention facilities with nighttime lighting signatures consistent with possible closure or decommissioning. With few exceptions, a set of four discrete growth trajectories emerged from this analysis that were consistently repeated across all 380 detention facilities in our dataset. These growth trajectories are as follows:
- Sustained Growth in nighttime lighting over the entire time period analyzed, with no or only marginal major periods of decline;
- Stable nighttime lighting over time, with either cyclical periods of growth and decline, or no major changes;
- Growth then Partial Decline in nighttime lighting, suggesting a major period of construction followed by a decline to still elevated levels of nighttime lighting; and
- Growth then Significant Decline in nighttime lighting, suggesting a major period of construction followed by a decline to levels of nighttime lighting at or near pre-construction levels.
Instead of manually assigning each detention facility based upon a visual review of their nighttime lighting over time, we instead developed an objective coding scheme to systematically classify the growth trajectory of each facility into one of these categories. This scheme took into account both the sequence in which a detention facility experienced either growth or decline, and the overall magnitude of these changes.
Assessing the Operating Status of Known Detention Facilities
Table One below summarizes the results of this classification process, showing the number of facilities in our dataset associated with each growth trajectory, along with the nighttime lighting trajectory of an example facility in each category.
Table One. Nighttime Lighting Growth Trajectories of Xinjiang Detention Facilities, 2014-2020
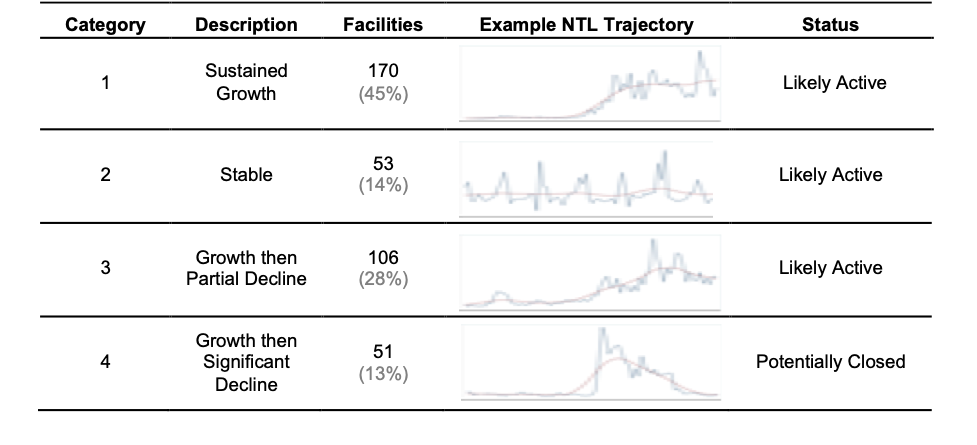
Overall, nearly half of the detention facilities in our dataset (170) experienced uninterrupted growth in nighttime lighting over time, suggesting that these facilities not only remain active to this day, but have continued to expand and grow since their initial construction. Similarly, 53 additional facilities (14 percent) demonstrate stable nighttime lighting signatures, with either inconsequential periods of growth or decline, or cyclical patterns that imply no major changes in operating status over time. In these cases, we rely upon ASPI's original assessment that these facilities actively serve as detention facilities, finding no evidence from nighttime lighting to suggest otherwise.
For an additional 106 facilities (28 percent), we see major periods of growth in nighttime lighting, followed by a partial decline to levels still well above the nighttime lighting seen prior to its initial growth. This implies, albeit not conclusively, that these facilities experienced either a decline in occupancy or an end to construction efforts, but not complete closure. As such, we assess that these facilities also remain active in some form, at least as of the last month in which we measure nighttime lighting in May 2020.
Combined, this analysis suggests that at least 87 percent of known Uyghur and ethnic minority detention facilities in Xinjiang exhibit nighttime lighting signatures consistent with ongoing detention efforts.
The final growth trajectory focuses on detention facilities experiencing significant declines in nighttime lighting over time, at or near the levels of electricity consumption seen prior to initial growth. Overall, our analysis suggests that only 51 facilities, or 13 percent of all known facilities, fit this pattern. The remainder of this report focuses on these facilities, to the extent that their nighttime lighting signatures may suggest potential closure.
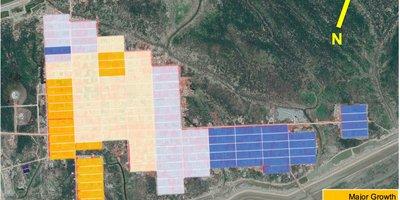
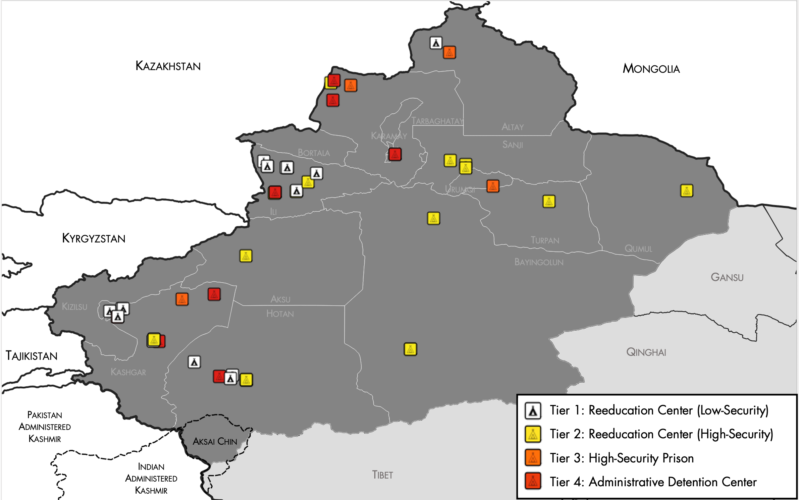
Figure Two below maps the location of these facilities across Xinjiang, broken down by their function within the broader Xinjiang detention system. With some exceptions, the majority of these facilities are concentrated in both northwest Xinjiang, along the border with Kazakhstan, and in southern Xinjiang's Hotan and Kashgar prefectures.
Figure Two. Location of Xinjiang Detention Facilities with Declining Nighttime Lighting Signatures
Investigating Potential Closure of Detention Facilities with Satellite Imagery
Significant declines in nighttime lighting could signal a number of different things about the current status of a detention facility. For one, it could signal that a detention facility was constructed but never occupied due to excess capacity elsewhere in the system. Alternatively, it could suggest that a facility proved too costly or remote to operate. In a dense urban area, major declines in nighttime lighting could signal that a facility was demolished to allow for future redevelopment. But large reductions in nighttime lighting alone do not necessarily mean that a facility has closed. It is feasible that large declines in nighttime lighting simply reflect the absence of prior electricity-intensive construction projects, or natural reversion to mean levels of nighttime lighting in otherwise well-electrified areas.
Acknowledging these varied interpretations, we then use overhead satellite imagery to provide additional fidelity on the current operating status of these facilities. Using nearly 400 overhead satellite images across these 51 locations, RAND searched for visible indicators of each facility's operating status in relation to its nighttime lighting signature. These indicators fell roughly into three general categories: evidence of human activity, changes in the repair or disrepair of facilities, and outright deconstruction of specific facilities.
In terms of visible human activity, overhead images of detention facilities occasionally revealed visible crowds of individuals standing in common areas, primarily at lower-security sites which often included recreational areas within a compound. As such, one marker of likely closure of a facility was the absence of visible human activity seen in prior imagery of the same site. Imagery also revealed distinct changes in the presence of vehicles in parking lots near the gates of some facilities, which offers a useful metric to gauge the presence of workers at such facilities over time. As for evidence of repair and disrepair at specific facilities, we focused solely on those signs likely to indicate an outright change in the operating status of a given facility. This included visible signs of snow removal (or lack thereof) during the winter, and in some cases, clear signs of overgrown vegetation in previously well-kept gardens. Finally, satellite imagery occasionally revealed the complete or partial demolition of detention facilities, suggesting likely closure.
On average, we analyzed nearly 8 separate satellite images for each facility over time. This included historical imagery from as early as 2006 (available through Google Earth), as well as a higher concentration of more recent imagery largely from the last two years (available via Digital Globe). In relatively few cases, we lacked sufficient imagery to make a full assessment. But in most cases, we were able to view satellite imagery at key inflection points in the nighttime lighting signature of a given facility, and correlate visible indicators in imagery with the timing of declines in nighttime lighting.
In total, we found affirmative evidence in satellite imagery consistent with the likely closure of only 11 detention facilities, out of the broader set of 51 facilities that experienced major declines in nighttime lighting. The locations and general characteristics of these facilities are summarized below in Table Two, along with our rationale for assessment.
Table Two. Xinjiang Detention Facilities with Evidence of Likely Closure
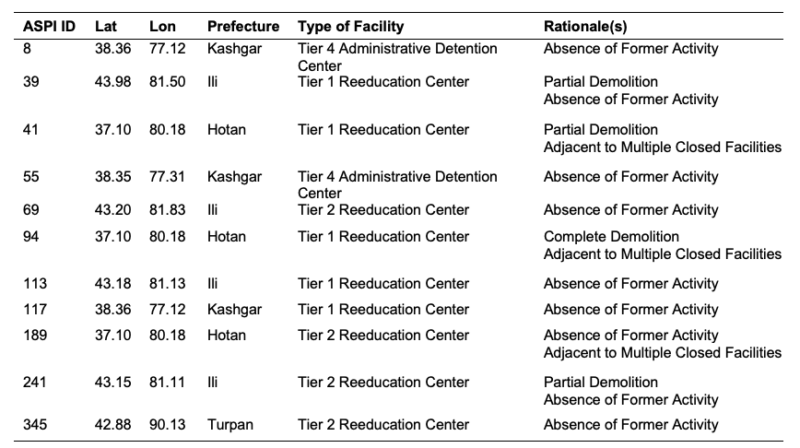
Overall, the majority of these 11 facilities appear to be Tier 1 and Tier 2 reeducation centers, although two administrative detention centers (Tier 4) in Kashgar also show evidence consistent with closure. Nearly all of these facilities are located in just three prefectures –Ili (5) in northwest Xinjiang, as well as Hotan (3) and Kashgar (3) in southern Xinjiang. However, these three prefectures account for nearly half of all known detention facilities in Xinjiang, so this is somewhat unsurprising.
The most common indicator seen in imagery consistent with likely closure was the absence of former human activity, primarily in terms of major changes in the volume of cars parked outside of detention facilities over time. RAND took careful effort to rule out alternative explanations for such changes in each instance, looking at the day of week and time of day captured for each image, as well as whether such cars could be associated with human activity at adjacent infrastructure. A smaller subset of facilities showed clear signs of demolition. And in some cases, either the absence of human activity or demolition was accompanied by similar changes in nearby adjacent facilities.
Examples of Likely Closed Detention Facilities
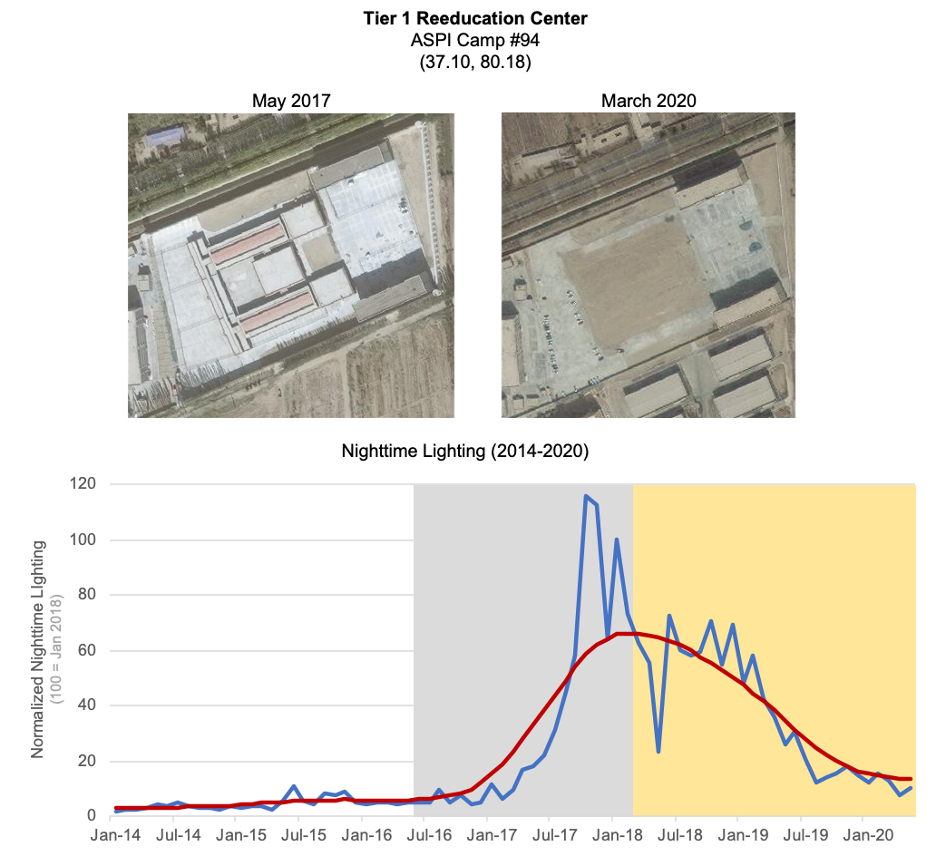
To demonstrate the types of visible indicators of closure seen in satellite imagery, two examples are presented below. Figure Three shows imagery and nighttime lighting data from a Tier 1 reeducation center in Hotan Prefecture we assess to be no longer operational. Nighttime lighting data show this facility experienced significant growth throughout 2017, with sustained levels of electricity consumption through late 2018. This correlates with evidence of major construction at this facility over the same time period seen in overhead imagery (not shown), as well as construction seen at two adjacent detention facilities. But by September 2018, satellite imagery reveals that the vast majority of this facility had been demolished, leaving only two buildings on the eastern portion of the camp. As a result, and based upon similar evidence of demolition seen in the facilities adjacent to this camp, we assess that this reeducation center is no longer operational.
Figure Three. Demolished Detention Facility in Hotan Prefecture, Xinjiang
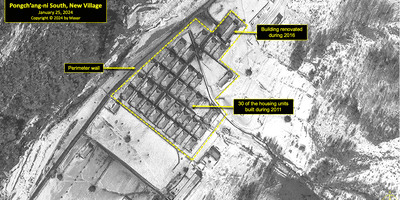
A second example is shown below in Figure Four. Despite the large spike in nighttime lighting seen in early 2015, most of this reeducation center in Ili Prefecture appears to have been constructed in early 2018 based upon satellite imagery (not shown). The facility appears to have been fully operational as of at least September 2018, with imagery from this time shown in the left panel of the figure below. Overall, this reeducation center is comprised of roughly half a dozen buildings inside a secured compound, and adjacent to what appears to be a driving school. Dozens of cars are also seen parked on the road outside the gate, potentially belonging to the workers at this facility given that they are concentrated near its entrance.
Figure Four. Likely Closed Detention Facility in Ili Prefecture, Xinjiang
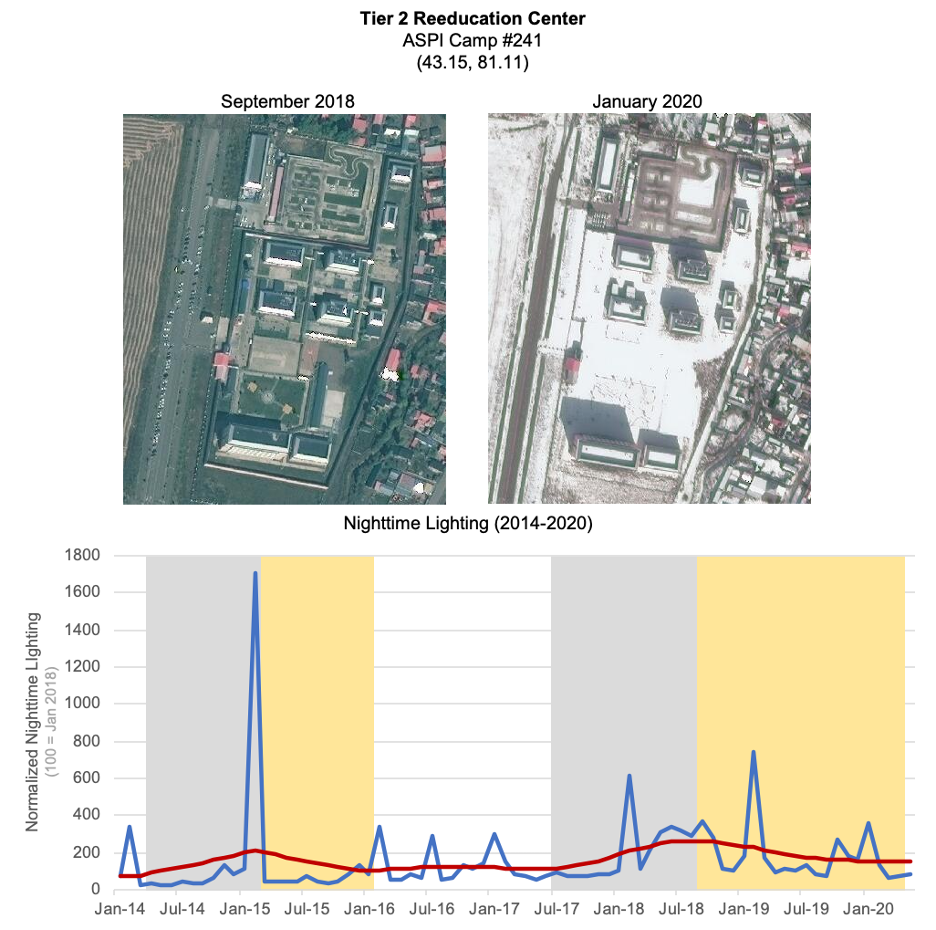
At some point between December 2018 and August 2019, overhead imagery shows that internal fencing and watchtowers surrounding the main buildings within this facility were removed. And by January 2020 (as shown in the right-hand panel above), the facility appears to be no longer operational. One building in the southeast corner has been demolished, and while snow has clearly been plowed on nearby roads and adjacent infrastructure, little effort has been made to clear snow from the roads, walkways, and common areas within this facility. Moreover, in this image as well as others taken soon before and well after this image, almost no vehicles are seen parked outside the front gate on the road outside this facility. Taken together with the overall decline in nighttime lighting seen during this time period, we assess that this facility is likely no longer operational.
For the remaining 40 facilities experiencing major declines in nighttime lighting, our analysis revealed little evidence consistent with potential closure. In some cases, we simply found no clear evidence either way to suggest a change in operating status, and default to ASPI's assessment that these camps were once operational, and therefore have likely remained so.
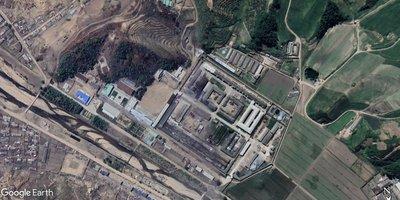
In other cases, overhead imagery shows affirmative evidence that detention facilities remain operational despite their declining nighttime lighting. One such example, shown below in Figure Five, is a low-security reeducation center in Ili Prefecture in northwestern Xinjiang. Despite a major period of decline in nighttime lighting throughout 2019 and early 2020, satellite imagery from May 2020 shows clear evidence of human activity in the courtyard of this facility. Specifically, three separate lines or queues of people can be seen forming out of the southern entrance to the main building of facility. Overall, the facility is well-maintained, and a new controlled entry point was built on the southern end between April and October 2019. While speculative, the entrance may have been relocated from the main artery (Route 315), to a smaller, less accessible side street that is easier to control, secure, and monitor traffic flow.
Figure Five. Likely Active Detention Facility in Ili Prefecture, Xinjiang

Key Takeaways
This report summarizes the results of RAND's systematic assessment of the operating status of Xinjiang detention facilities. Overall, we find that only 13 percent of detention facilities in Xinjiang experienced major declines in nighttime lighting in recent years that may suggest closure. Moreover, once satellite imagery data are layered on top of this analysis, we find that just 3 percent of detention facilities in Xinjiang show clear evidence consistent with closure of these facilities. These findings cast further doubt upon official Chinese government claims to have ceased or relaxed efforts to reeducate, detain, and imprison Uyghur and other ethnic minority populations in Xinjiang.
Of note, ASPI's original investigation into these 380 facilities concluded that eight facilities showed evidence of decommissioning based solely upon overhead imagery – a roughly comparable estimate. However, our analysis suggests that only five of the eight facilities deemed decommissioned by ASPI are likely closed. For the cases in which we differ, our nighttime lighting estimates suggest that these facilities remain operational. And yet, ASPI's determination that such facilities were decommissioned appears to have been based, in part, on such facilities changing purpose (e.g. from a prison to a reeducation center), rather than closing down for good.
May 01, 2020
101 Detention Facilities with Major NTL Decline (27%)
Apr 01, 2020
110 Detention Facilities with Major NTL Decline (29%)
Mar 01, 2020
120 Detention Facilities with Major NTL Decline (32%)
Feb 01, 2020
126 Detention Facilities with Major NTL Decline (33%)
Jan 01, 2020
126 Detention Facilities with Major NTL Decline (33%)
Dec 01, 2019
128 Detention Facilities with Major NTL Decline (34%)
Nov 01, 2019
131 Detention Facilities with Major NTL Decline (34%)
Oct 01, 2019
133 Detention Facilities with Major NTL Decline (35%)
Sep 01, 2019
134 Detention Facilities with Major NTL Decline (35%)
Aug 01, 2019
135 Detention Facilities with Major NTL Decline (36%)
Jul 01, 2019
136 Detention Facilities with Major NTL Decline (36%)
Jun 01, 2019
134 Detention Facilities with Major NTL Decline (35%)
May 01, 2019
134 Detention Facilities with Major NTL Decline (35%)
Apr 01, 2019
129 Detention Facilities with Major NTL Decline (34%)
Mar 01, 2019
124 Detention Facilities with Major NTL Decline (33%)
Feb 01, 2019
109 Detention Facilities with Major NTL Decline (29%)
Jan 01, 2019
88 Detention Facilities with Major NTL Decline (23%)
Dec 01, 2018
75 Detention Facilities with Major NTL Decline (20%)
Nov 01, 2018
65 Detention Facilities with Major NTL Decline (17%)
Oct 01, 2018
64 Detention Facilities with Major NTL Decline (17%)
Sep 01, 2018
59 Detention Facilities with Major NTL Decline (16%)
Aug 01, 2018
55 Detention Facilities with Major NTL Decline (14%)
Jul 01, 2018
54 Detention Facilities with Major NTL Decline (14%)
Jun 01, 2018
39 Detention Facilities with Major NTL Decline (10%)
May 01, 2018
37 Detention Facilities with Major NTL Decline (10%)
Apr 01, 2018
32 Detention Facilities with Major NTL Decline (8%)
Mar 01, 2018
34 Detention Facilities with Major NTL Decline (9%)
Feb 01, 2018
29 Detention Facilities with Major NTL Decline (8%)
Jan 01, 2018
23 Detention Facilities with Major NTL Decline (6%)
Dec 01, 2017
22 Detention Facilities with Major NTL Decline (6%)
Nov 01, 2017
22 Detention Facilities with Major NTL Decline (6%)
Oct 01, 2017
23 Detention Facilities with Major NTL Decline (6%)
Sep 01, 2017
19 Detention Facilities with Major NTL Decline (5%)
Aug 01, 2017
20 Detention Facilities with Major NTL Decline (5%)
Jul 01, 2017
20 Detention Facilities with Major NTL Decline (5%)
Jun 01, 2017
18 Detention Facilities with Major NTL Decline (5%)
May 01, 2017
17 Detention Facilities with Major NTL Decline (4%)
Apr 01, 2017
17 Detention Facilities with Major NTL Decline (4%)
Mar 01, 2017
17 Detention Facilities with Major NTL Decline (4%)
Feb 01, 2017
15 Detention Facilities with Major NTL Decline (4%)
Jan 01, 2017
13 Detention Facilities with Major NTL Decline (3%)
Dec 01, 2016
14 Detention Facilities with Major NTL Decline (4%)
Nov 01, 2016
15 Detention Facilities with Major NTL Decline (4%)
Oct 01, 2016
16 Detention Facilities with Major NTL Decline (4%)
Sep 01, 2016
18 Detention Facilities with Major NTL Decline (5%)
Aug 01, 2016
19 Detention Facilities with Major NTL Decline (5%)
Jul 01, 2016
23 Detention Facilities with Major NTL Decline (6%)
Jun 01, 2016
26 Detention Facilities with Major NTL Decline (7%)
May 01, 2016
30 Detention Facilities with Major NTL Decline (8%)
Apr 01, 2016
34 Detention Facilities with Major NTL Decline (9%)
Mar 01, 2016
42 Detention Facilities with Major NTL Decline (11%)
Feb 01, 2016
41 Detention Facilities with Major NTL Decline (11%)
Jan 01, 2016
49 Detention Facilities with Major NTL Decline (13%)
Dec 01, 2015
51 Detention Facilities with Major NTL Decline (13%)
Nov 01, 2015
52 Detention Facilities with Major NTL Decline (14%)
Oct 01, 2015
51 Detention Facilities with Major NTL Decline (13%)
Sep 01, 2015
50 Detention Facilities with Major NTL Decline (13%)
Aug 01, 2015
51 Detention Facilities with Major NTL Decline (13%)
Jul 01, 2015
51 Detention Facilities with Major NTL Decline (13%)
Jun 01, 2015
48 Detention Facilities with Major NTL Decline (13%)
May 01, 2015
47 Detention Facilities with Major NTL Decline (12%)
Apr 01, 2015
47 Detention Facilities with Major NTL Decline (12%)
Mar 01, 2015
46 Detention Facilities with Major NTL Decline (12%)
Feb 01, 2015
42 Detention Facilities with Major NTL Decline (11%)
Jan 01, 2015
39 Detention Facilities with Major NTL Decline (10%)
Dec 01, 2014
31 Detention Facilities with Major NTL Decline (8%)
Nov 01, 2014
29 Detention Facilities with Major NTL Decline (8%)
Oct 01, 2014
26 Detention Facilities with Major NTL Decline (7%)
Sep 01, 2014
26 Detention Facilities with Major NTL Decline (7%)
Aug 01, 2014
22 Detention Facilities with Major NTL Decline (6%)
Jul 01, 2014
20 Detention Facilities with Major NTL Decline (5%)
Jun 01, 2014
20 Detention Facilities with Major NTL Decline (5%)
May 01, 2014
20 Detention Facilities with Major NTL Decline (5%)
Apr 01, 2014
18 Detention Facilities with Major NTL Decline (5%)
Mar 01, 2014
17 Detention Facilities with Major NTL Decline (4%)
Feb 01, 2014
17 Detention Facilities with Major NTL Decline (4%)
Jan 01, 2014
0 Detention Facilities with Major NTL Decline (0%)
Look Ahead
This report, the second in a series of three, used nighttime lighting and satellite imagery data to systematically assess the current operating status of known Uyghur and ethnic minority detention facilities in Xinjiang, and revealed that less than three percent of these facilities exhibit clear signs of potential closure. Our final report in this series will explore macro-level trends in the growth and decline of specific types of facilities across Xinjiang, to help better assess the future trajectory of China's widespread detention of Uyghur and ethnic minority populations in the region.
Things to Watch
- What factors explain the varied growth and decline of different types of detention facilities in Xinjiang?
- Can overhead satellite imagery provide further insight into the operating status of other detention facilities experiencing only partial declines in nighttime lighting?
- Can other forms of geospatial data be used to validate these results?
About The Authors
Research Programmer/Analyst, RAND
Policy Analyst, RAND Corporation

Methodologies Reviewed by NGA
Publication of this article does not constitute an endorsement of the contents, conclusions, or opinions of the author(s). The published article’s contents, conclusions, and opinions are solely that of the author(s) and are in no way attributable or an endorsement by the National Geospatial-Intelligence Agency, the Department of Defense, the United States Intelligence Community, or the United States Government. For additional information, please see the Tearline Comprehensive Disclaimer at https://www.tearline.mil/disclaimers.