Overview
Evaluating the impact of SEZ development on land, water and air using satellite imagery, we identify examples of where zones appear to be succeeding or struggling to preserve and protect their local environmental conditions.
Through imagery, we can identify subtle changes in the environment and apparent violations of sustainability principles in some Chinese SEZs, including dumping and landfills. GEOINT is also valuable for mapping local infrastructure around current or future zones to predict the environmental areas of greatest need.
Activity
Imagery will be used to both identify current problem areas in the environment, and to assess their severity in relation to the other zones surveyed. The focus is on locating the presence of facilities to offset these impacts as well as looking for evidence of current environmental degradation.
Evaluating Environmental Sustainability
SEZs come in all shapes and sizes, often even spanning several industries within the same zone. This variation, and the differences in pollution standards, make direct comparisons challenging. So while using imagery to evaluate environmental sustainability requires visible SEZ features with likely environmental impact, such as steel mills, power plants, and oil refineries, we drew on a variety of sources to generate a more balanced assessment of environmental risk. Therefore, our analysis focuses on locating the presence of SEZ features that are associated with environmentally sustainable practices, and not solely on an SEZs carbon footprint.
We selected indicators associated with land use, water treatment, air quality, and waste management. These indicators are built upon the larger body of sustainable development goals (SDGs) published and promoted by the United Nations. As an established, international framework of sustainable practices, the SDGs serve as a key repository of industry-accepted standards. China's public acknowledgment of SDGs, and their effect on overseas special economic zones, was outlined in a 2019 report conducted by the Chinese Academy of International Trade and Economic Cooperation. While this report is informative, and not legally binding, its publication by a government think tank to an international body shows that Chinese developers are well aware of what it takes to build and operate sustainable zones. Our research will show whether this knowledge is being passed along to the actual operators of Chinese overseas SEZs around the world.
Next, we will explain how we operationalized these indicators.
Indicators
Land Use Framework
Sustainable land use has two components. The first is the existence of a regulatory framework that governs land stewardship and environmental obligations. These frameworks are composed of both real estate laws that explain details of land ownership within the SEZ, and the environmental regulations of the host nation, as illustrated in Section B of this world investment report from 2019. Environmental law for SEZs can enumerate requirements for producing environmental impact studies, as well as ensuring that companies within SEZs remain under the jurisdiction of national environmental law. As an example, China's domestic low-carbon industrial park program, from 2013, began piloting mandatory preservation of green space within SEZs. The presence of programs like this gives us an opportunity to check if this leading environmental practice has made it to China's overseas projects. We will evaluate zones based on the presence on the existence and strictness of SEZ regulation, as well as using imagery to assess compliance by zone operators.
Water Treatment Facilities
We measure water quality in terms of identifiable water treatment facilities. These facilities are a key feature for achieving long-term sustainability, as seen in the framework on page 190, and applicable SEZ environmental laws can require them.
Air pollution emissions
We measure air quality in terms of the zone's source of energy production. All zones require electricity, guaranteeing it will be a shared feature, and since the zones we evaluated house vastly different industries, variation in the nominal amount of air pollution is expected. The indicator will assess whether the zone is reliant primarily on non-renewable energy sources or if it is blended with renewables. If available, we will also include information on whether emission capture technologies are present.
Waste Disposal Facilities
We measure a zone's waste disposal in terms of its facilities for disposing of solid waste. Waste disposal facilities are another required feature across SEZ regulation, such as seen in section 3.1 of Cambodia's SEZ law. We assess SEZs on a scale from simply dumping into the local environment to providing on-site, waste-to-energy facilities.
Analysis
Land Use
Across zones, we found SEZs with strong regulatory and oversight frameworks provide general quality assurance for zones in a way no other indicator did. Of note was the Ethiopian Eastern Industrial Zone which showed strong performance across all our environmental indicators.
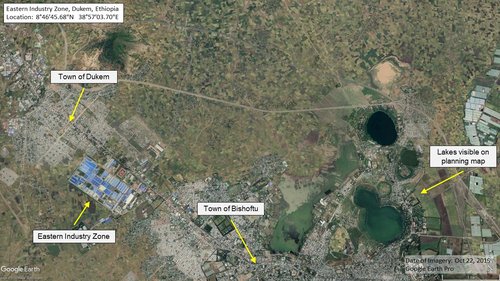
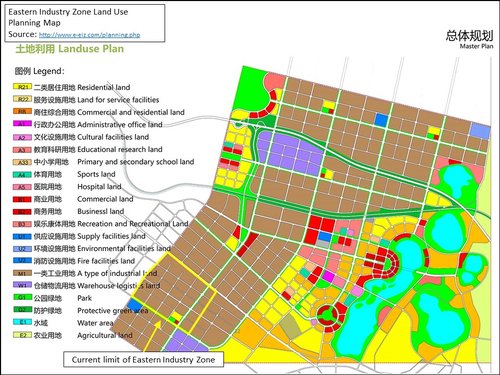
The Eastern Industry Zone (EIZ) is governed by Ethiopian law from 2015 that sets national SEZ policy. It requires adherence to all Ethiopian environmental law as well as the establishment of the Ministry of Environment offices inside of each zone.1 This type of close government enforcement was not required during the EIZ's early stages, but its eventual enactment shows that Ethiopia is learning from experience and trying to improve its environmental enforcement despite initial problems and setbacks. As the image above illustrates, the Eastern Industry Zone has managed to adhere closely to its development plan - something that cannot be said for all our zones.
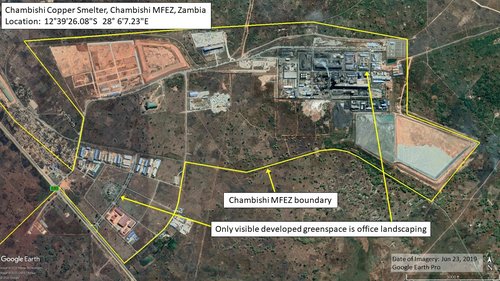
Alternatively, the Zambia Chambishi Multi-Function Economic Zone (MFEZ) was the weakest performer in this category and displayed several features consistent with environmental degradation. Zambia's SEZ regulations only force its zones to provide an initial environmental impact assessment and to provide standard economic infrastructure. There is no explicit land-use framework governing zoning, and we observe minimal visible green space within the boundary of the zone. Furthermore, this lack of regulation and oversight has allowed zone operators to engage in acts of environmental damage including dumping mine waste into local rivers and pumping illegal quantities of pollutants into the air.2
Water Treatment
Water treatment was one of the most reliable indicators we used, providing a unique visual signature that we could identify in most zones. Kawasan Industri Terpadu Indonesia China (KITIC) and Khorgos Eastern Gates SEZ were the highest performers in terms of water treatment. Both appear to have developed multiple on-site treatment facilities. Khorgos has developed water treatment facilities capable of treating 3,000 m3/ day, as well as a drinkable water supply system and a sewage pipeline and collections system.
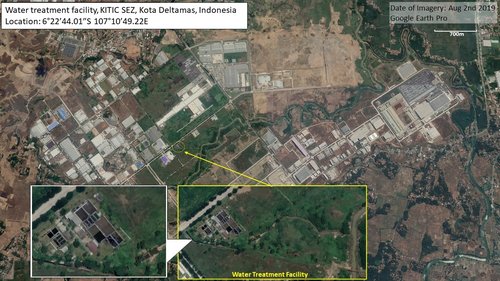
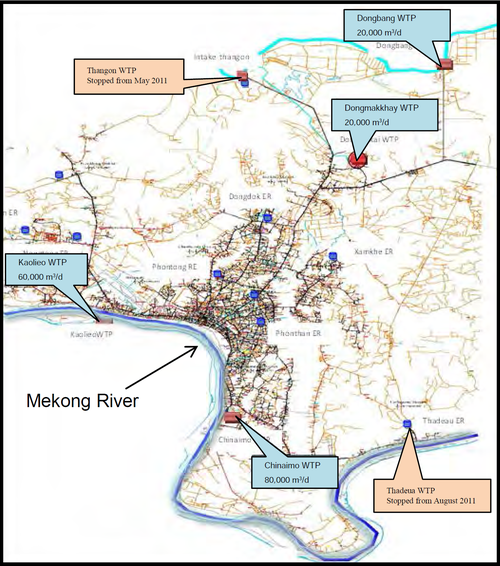
Other zones have had decidedly mixed results. Zones operating in countries with poorly enforced regulatory frameworks can be legally committed to building on-site water treatment facilities but may not have constructed them even as industrial operations in the zone begin. Laos, a country with a history of poor enforcement, allowed Saysettha Development Zone, near Laos's capital of Vientiane, to offload all its water treatment burden onto already taxed municipal facilities. Despite Laotian law requiring SEZs to provide wastewater treatment facilities, 10 years after its creation, Saysettha still divides its water treatment burden across four municipal facilities: Chinaimo, Kaoleio, Dongmakkhay and Dongban. As of 2014, these facilities were unable to meet their existing municipal treatment responsibilities and only through the rapid expansion of existing facilities is supply able to even catch up to growing demand.
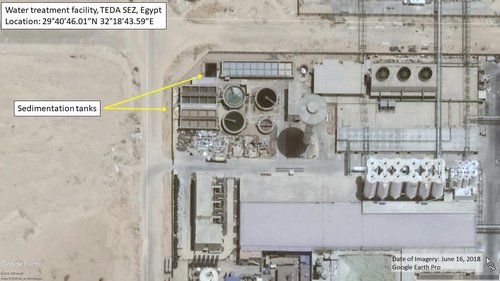
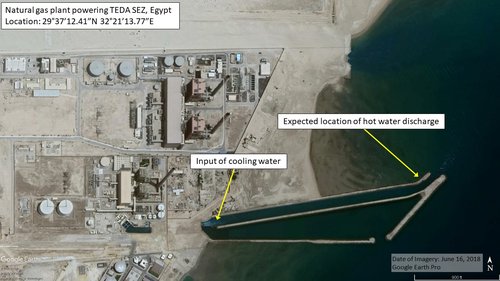
While our analysis emphasized indicators that are commonly found within all our zones, there are also additional sources of water contamination, related to SEZ operations, but located outside of our zones. A particularly noticeable example of this is the TEDA Suez Economic and Trade Cooperation Zone in Egypt. The TEDA zone has an on-site treatment station; however, its off-site natural gas power plant appears to directly dump water used for cooling the plant back into the Red Sea. Although this type of thermal effluent is potentially a source of undesirable effects on local marine ecosystems, we do not consider it in our scoring because the plant is not a direct part of the SEZ. While a zone operator may not be responsible for the operation of a separate power plant, this demonstrates that environmental effects from an SEZ may escape its physical boundaries and produce regional effects.
Air Pollution
The difference between most zones turned out to be the level of energy diversification: whether plants exclusively used fossil fuels (coal or natural gas) generation plants or integrated renewable energy sources. In several zones, including Saysettha, we identified renewable hydroelectric energy sources in addition to traditional coal or LNG facilities. Zones with diverse energy sources earn a higher score than those that solely use fossil fuels. But the expense of integrating renewable sources, in comparison to the cheaper alternative of coal, may create strong economic pressures against selecting the more sustainable alternative.
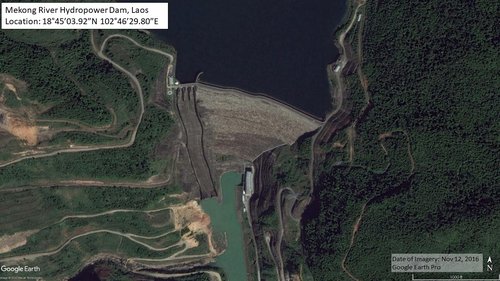
In the case of Saysettha there was a readily available renewable energy source in the Mekong river that was cost-competitive with coal-fired thermal plants. This investment in the Mekong hydropower dam system now powers 53% of the country, including the zone.
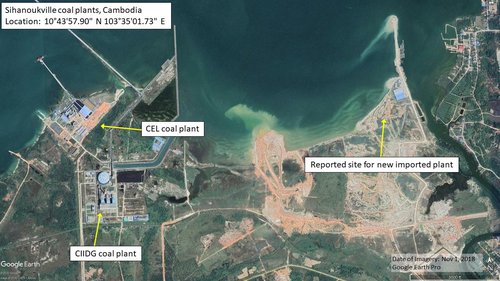
Alternatively, the worst performers were entirely reliant on coal-fired thermal plants with no additional emissions control features. Sihanoukville in Cambodia, for example, is entirely reliant on lignite-fired coal power plants. The current energy supply is provided by two different plants, provided by Cambodia Energy Limited (CEL) and the Cambodia International Investment Development Group (CIIDG). Both plants are undergoing expansions, with CIIDG building a dedicated transmission line to the SEZ to ensure consistent supply. Despite this rapid growth in power in the last 10 years, the Sihanoukville SEZ is also moving forward with building a 5 boiler, 100 MW coal plant inside the zone itself. Regional energy supply is also soon to be supplemented with another imported Chinese coal plant whose SOX, NOX, VOC and CO2 profile has been deemed too dangerous and polluting for China.3
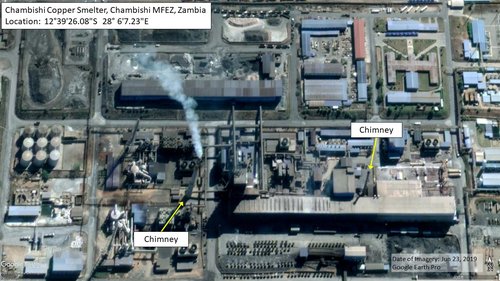
Although we do not score zones based on their industrial activities, the imagery suggests these can be a significant additional source of pollution. For example, the Chambishi zone features several copper smelting furnaces, which emit potentially harmful gases out of large attached chimneys. Beginning operation in 2008, a 2014 investigation by the Zambian Environmental Management Agency saw that from 2009-2011, Chambishi either did not report, or exceeded the statutory limit, on sulfur dioxide emissions for every month on record. A newly constructed facility, for the first three years of operation, demonstrably violated Zambian environmental law. This case shows the need for both strict regulatory enforcement, as well as not relying on any assumptions that newer facilities will necessarily prove to be more sustainable.
Once again, it is worth mentioning that there are multiple sources of air pollution that were not directly incorporated into our scoring. These limitations are observable in the TEDA Suez SEZ, which houses the Jushi fiberglass factory, a product whose production can emit unhealthy air emissions.
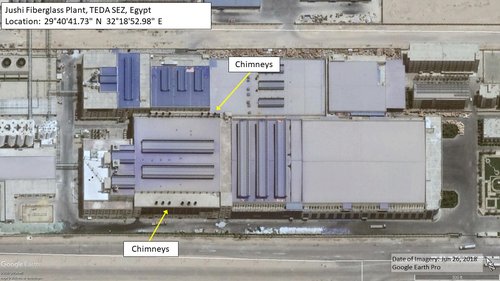
Our selected indicator does not account for the emissions produced by the industrial output of these type of factories, for example, the fiberglass plant, since they do not qualify as primary energy-producing facilities.
Waste Management
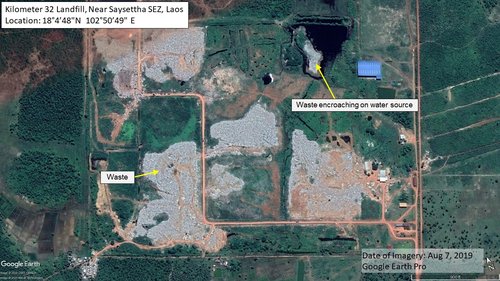
We lacked sufficient imagery to evaluate several zones for waste management, but those zones for which we could identify features scored poorly. The most common form of waste management across our zones appears to be landfilling or dumping. This is unsurprising as many SEZ laws require waste management procedures but do not specify or require sustainable recycling or waste to energy practices. Saysettha, for example, contracted out its solid waste management which has resulted in all its waste being dumped in one of Laos largest landfill sites K.M.32.4
KITIC in Indonesia has fulfilled its minimum waste disposal requirement by utilizing the Bekasi Controlled Landfill Disposal Facility located in the suburbs of Jakarta, and already receives 6,000 tons/day of waste.5 It is likely that the SEZ is adding a significant waste burden to an already heavily utilized landfill.
Based on existing imagery and information, we were unable to evaluate waste treatment capacity at several zones, including TEDA, Khorgos and Pengsheng.
Conclusion
Development of SEZs increase the risk of negative economic impacts and sustainability practices should be a major concern. Our assessment of Chinese overseas SEZs has demonstrated that while China has publicly declared its commitment to reducing the environmental impact of SEZ development, its track record in establishing environmentally sustainable SEZs abroad has been mixed. Of ten zones evaluated, several showed good performance with respect to land use, air protection, water treatment, and waste management. However, other zones, such as Chambshi and Ogun-Guangdong, fared very poorly, suggesting sustainability principles are inconsistently applied in China's SEZs.
Time and resource limitations limited the number of indicators we used as well as our ability to evaluate zone types. Further analysis evaluating zones by key industries such as mining or manufacturing could provide more granular interpretations.
In the next part of this series, we evaluate China's overseas SEZs impact on workers and local residents.
References
- Proclamation 866-20, Government of Ethiopia, http://www.investethiopia.gov.et/images/pdf/Industrial%20Parks%20Proclamation%20No%20886_2015.pdf; https://static1.squarespace.com/static/5652847de4b033f56d2bdc29/t/5cdc2a848165f5c5cfd8ba68/1557932677135/WP-2019-05-Tang-Ethiopia-and-Vietnam-SEZ.pdf
- https://www.ago.gov.zm/?wpfb_dl=104
- https://www.chinadialogue.net/article/show/single/en/11474-Coal-plant-deemed-too-polluting-for-China-heads-to-Cambodia
- https://www.waste.ccacoalition.org/sites/default/files/files/waste_mnmt_report_vientiane_laopdr_by_rrcap.pdf
- https://openjicareport.jica.go.jp/pdf/12040044.pdf
Oct 26, 2016
MOFCOM recognition of Pengsheng Industrial Park
Mar 28, 2013
China Launches the Belt and Road Initiative
Jun 01, 2010
MOFCOM recognition of Saysettha Development Zone
Apr 06, 2009
MOFCOM recognition of Sihanoukville SEZ
Nov 01, 2007
MOFCOM recognition of Lekki Free Zone
Nov 01, 2007
MOFCOM recognition of TEDA Suez SEZ
Nov 03, 2006
MOFOCM recognition of Ogun-Guangdong SEZ
Nov 03, 2006
MOFCOM recognition of Zambia-China Economic and Trade Cooperation Zones (ZCCZ)
Mar 06, 2006
China Launches Overseas Special Economic Zones
Mar 15, 2000
China Launches "Going Global" Strategy
Look Ahead
Going forward, assessing progress in environmental sustainability for SEZs will involve identifying waste treatment facilities and sources of renewable energy, and measuring changes in their size. Research should continue focusing on seeing whether promised environmental sustainability practices are being implemented in reality, and whether the scale of these efforts is in accordance with the size of the zone. Continued vigilance in monitoring will be required as zones expand and new companies begin to take up residence.
Things to Watch
- Can we identify multiple sources of electricity within zones, or what type of energy is powering the grid that the zone is connected to?
- How do we find evidence that treatment facilities are operating as intended? What are the possible indicators from imagery?
- What are the optimal proportions of greenspace to industry for sustainable zone design?
About The Authors
Columbia University, School of International and Public Affairs, 2020
Columbia University, School of International and Public Affairs, 2020
Columbia University, School of International and Public Affairs, 2020
Columbia University, School of International and Public Affairs, 2020
Columbia University, School of International and Public Affairs, 2020

Methodologies Reviewed by NGA
Publication of this article does not constitute an endorsement of the contents, conclusions, or opinions of the author(s). The published article’s contents, conclusions, and opinions are solely that of the author(s) and are in no way attributable or an endorsement by the National Geospatial-Intelligence Agency, the Department of Defense, the United States Intelligence Community, or the United States Government. For additional information, please see the Tearline Comprehensive Disclaimer at https://www.tearline.mil/disclaimers.

