Overview
Imagery analysis suggests a native melon species in the Namib Desert may be a quantifiable proxy for the intensity of rain events due to climate change. This intensity in turn may be a leading indicator of economic and political unrest in the Namib Desert region because the melon is a primary source of food for the Topnaar people.
The !nara plant (scientific name: Acanthosicyos horridus) is a deep-rooted melon native to the Namib Desert. The plant, often found in ephemeral river channels, is susceptible to damage during major flooding events. Such events are increasingly common despite an overall decrease in smaller, more regular precipitation events. This study shows that !nara melon count is linked to the increased intensity of rain events likely driven by climate change.
Activity
This study developed and deployed an algorithm to detect the presence of !nara in the Namib region, which is linked to the volatility of rain in the region due to climate change in addition to being a food source for the Topnaar people, providing a tangible link between climate change and a people group in Namibia. The effects of a changing climate, including increased aridity and less frequent but more substantial flooding events, introduce strain on hydrologic conditions and subsequently plants, such as !nara, and the ecosystems that support their existence. Given the plant's direct reliance on water availability, it can be used as a proxy for identifying the impacts of changing climatic and hydrologic conditions in the Namib Desert.
!Nara Melons: An Overview
During increased rainfall over shorter periods, plants are subjected to sedimentation and erosion, harming plant health and hindering growth. As a fundamental component of the ecosystem of the Namib Desert, changes in the development and prevalence of !nara are critical to understanding the future of plant availability, regional hydroclimate conditions, and water availability. !Nara is a common source of food for the livestock herds of the indigenous Topnaar people, as well as a food and water source for wild animals. Additionally, the melons are harvested by the Topnaar for seeds to be consumed and processed into oils, and the fruit pulp is used in a variety of products. The !nara melon relies on two primary sources of water: deep tap roots to access groundwater, and water uptake from fog.
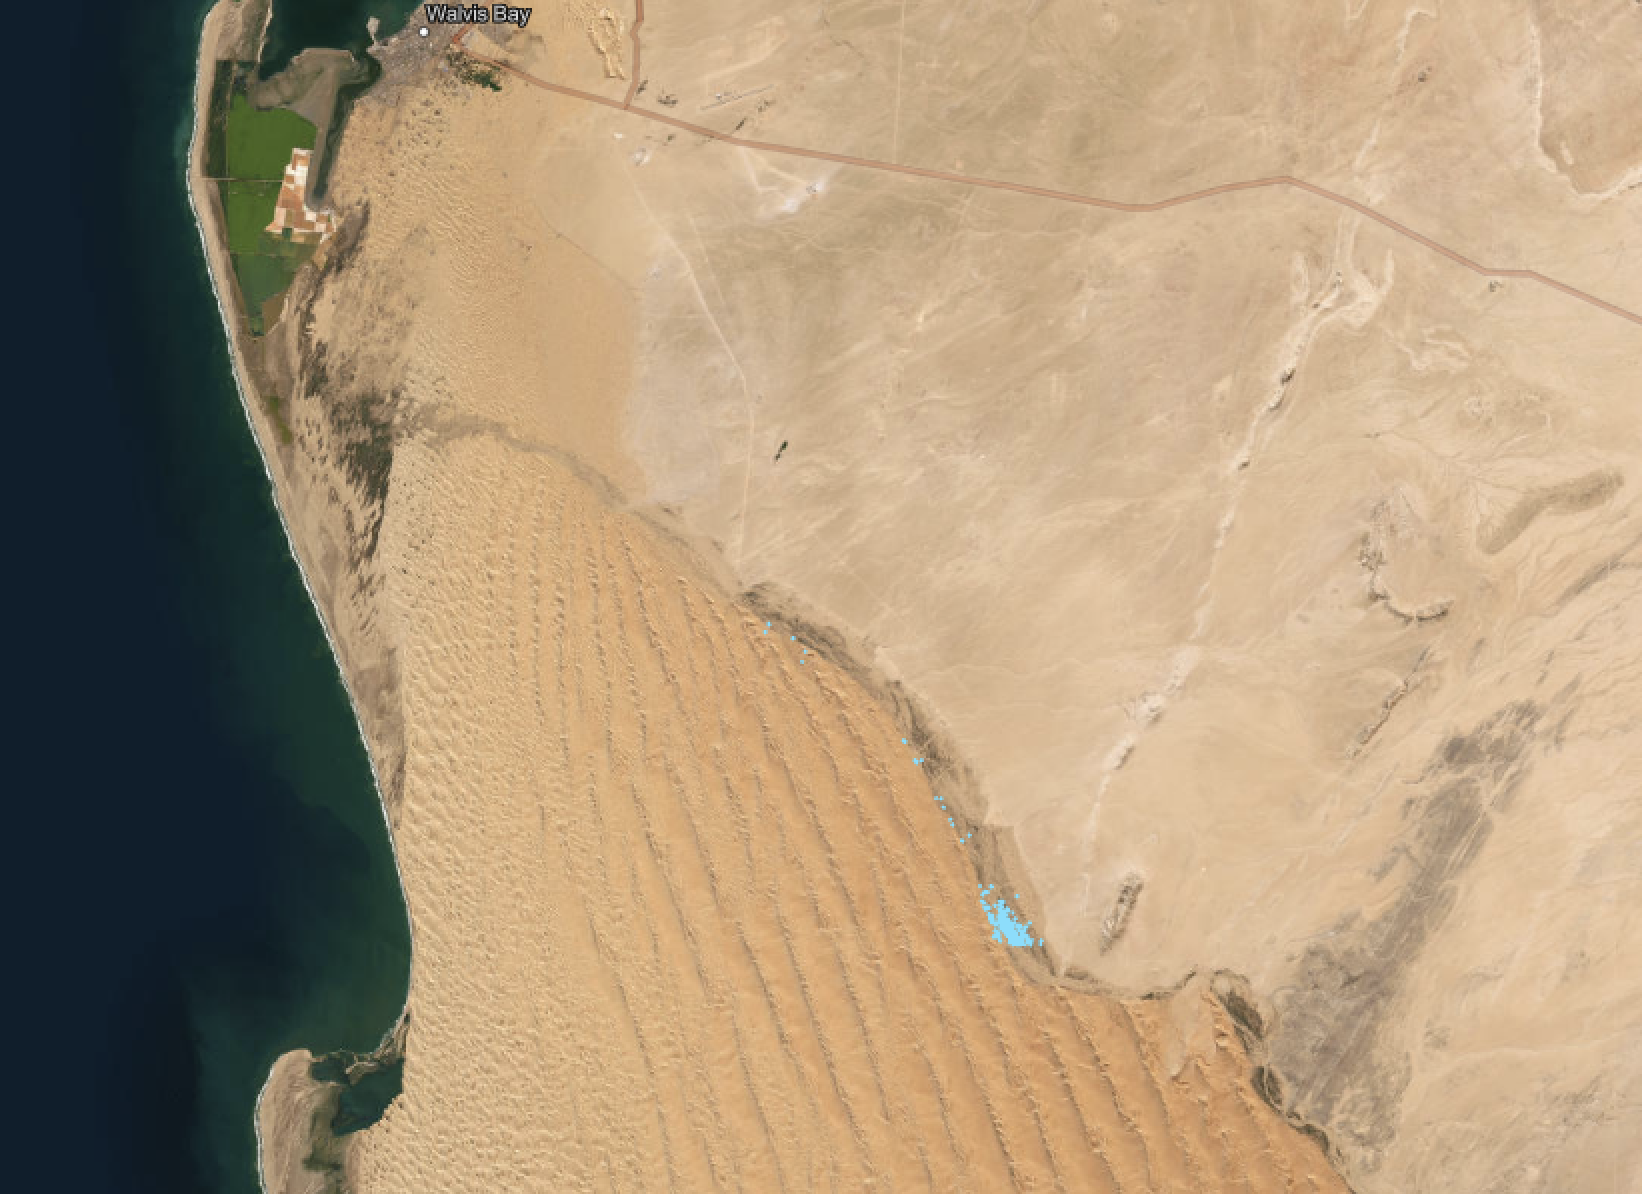
Geographical Context: Namibia & Area of Interest
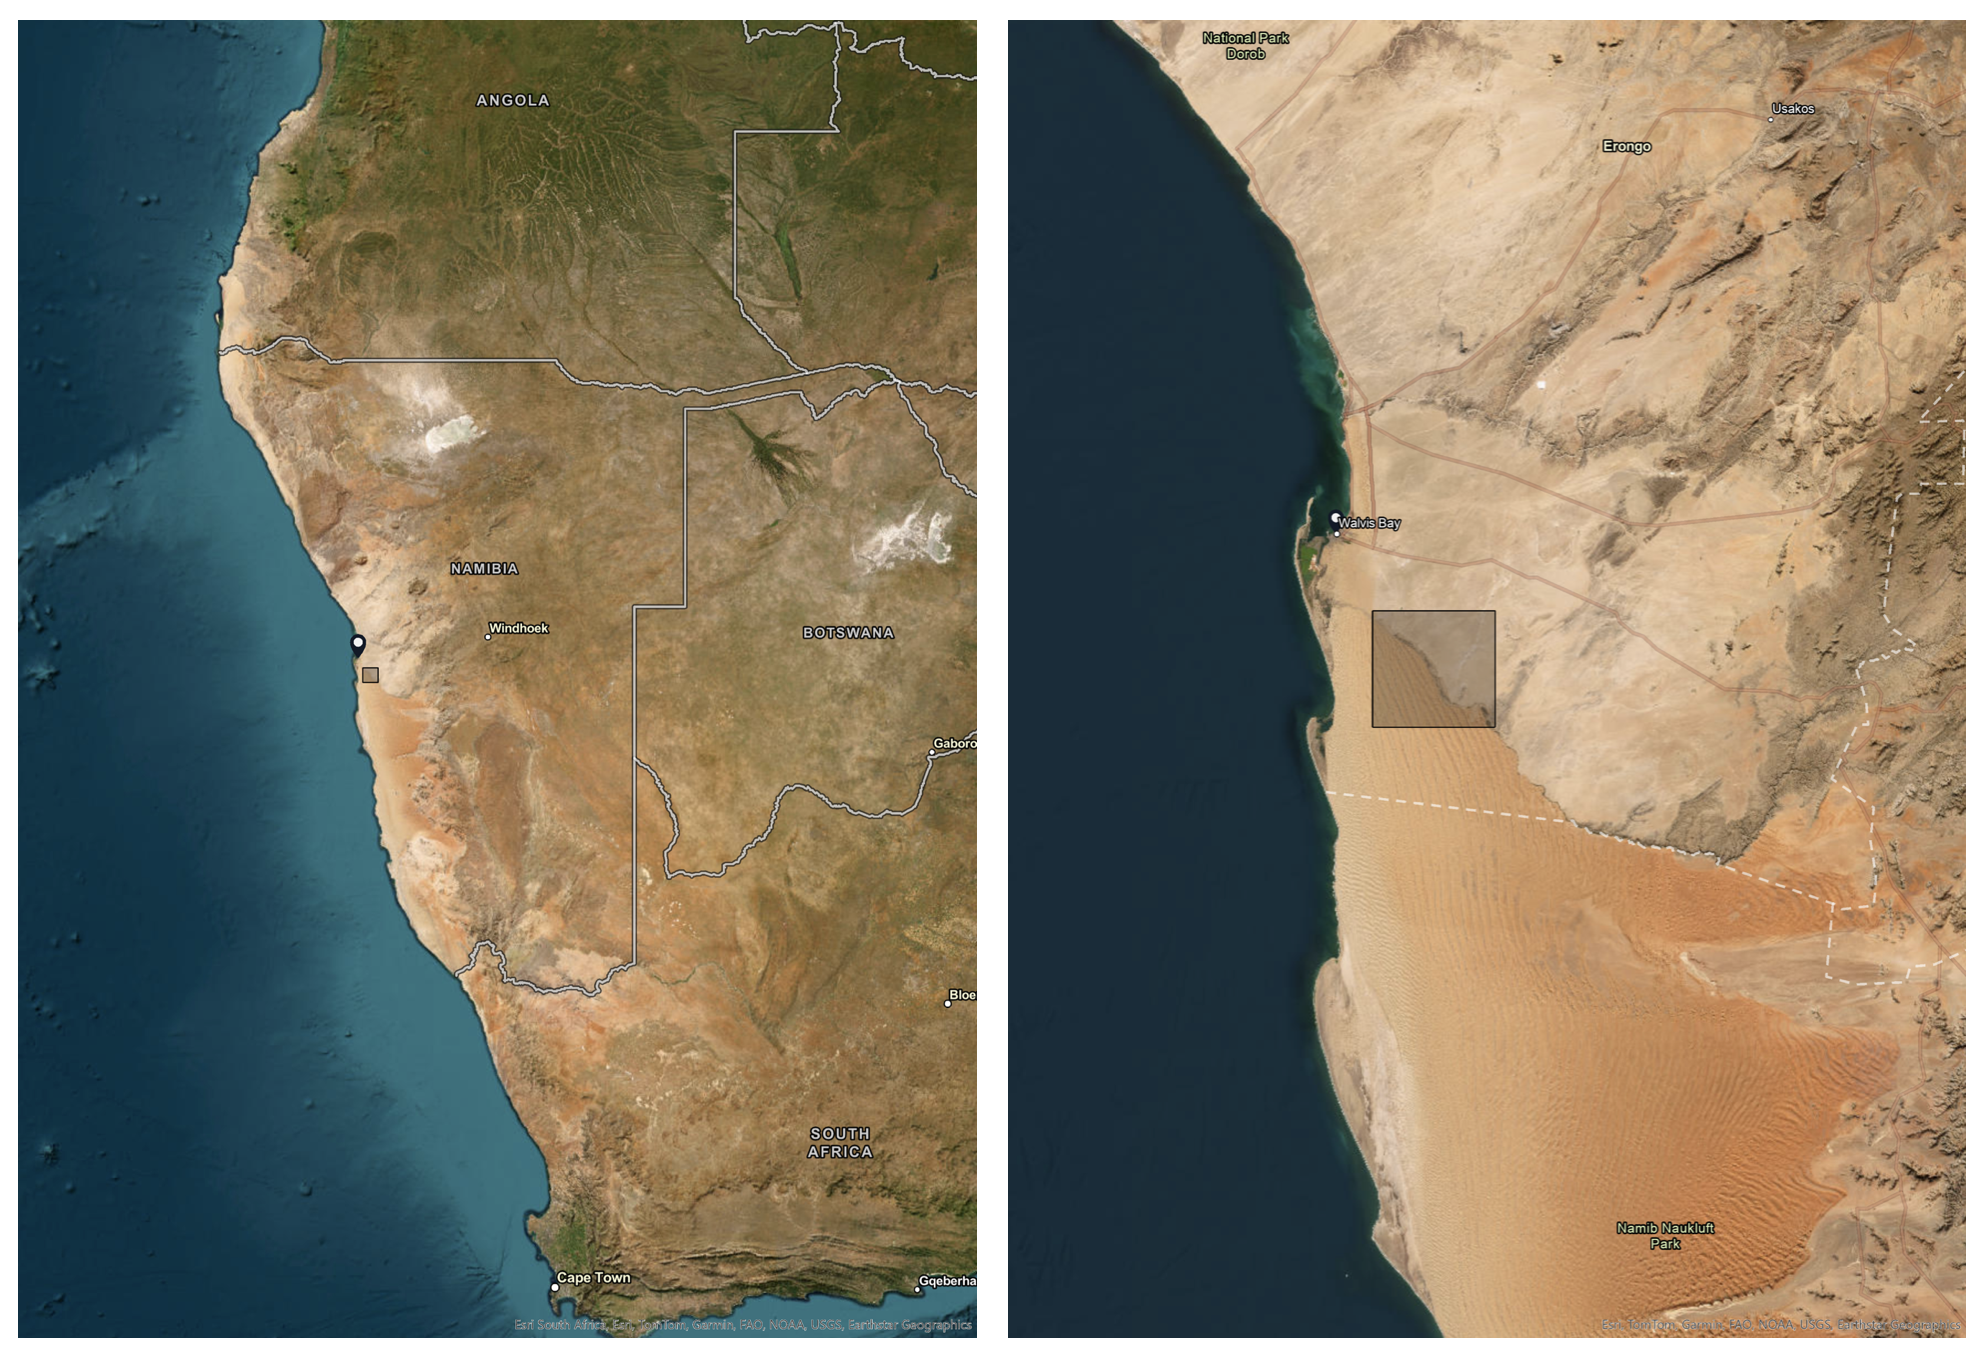
Namibia’s largest desert, the Namib Desert, is the focus of this research. The Kuiseb River, an ephemeral river channel, runs from the Khomas Highlands to the Atlantic Ocean. The river divides the northern stone desert from the southern sand dune sea. This desert is thought to be the oldest in the world and its name comes from Nama meaning "endless expanse". This region has a complicated colonial history placing our project in a legacy of outsiders entering this region. Because of this, understanding the history, systems, and realities of locals is essential to understanding the potential impacts (both positive and negative) of this work.
The Indigenous people to the Kuiseb basin are the Topnaar (also known as ‡Aonin) people who live in small villages along the river and have many traditional uses for !nara melons. Today, !nara provides substantial economic value to Topnaar people through its pulp, seeds, sap and fruit, which are sold locally. This study will measure the number of !nara plants available in a sampled area of the Namib Desert. Since !nara is a primary food source, along with being a vital trade good for the local populace, the results of this study may inform additional research on the likely impacts of climate change in the region.
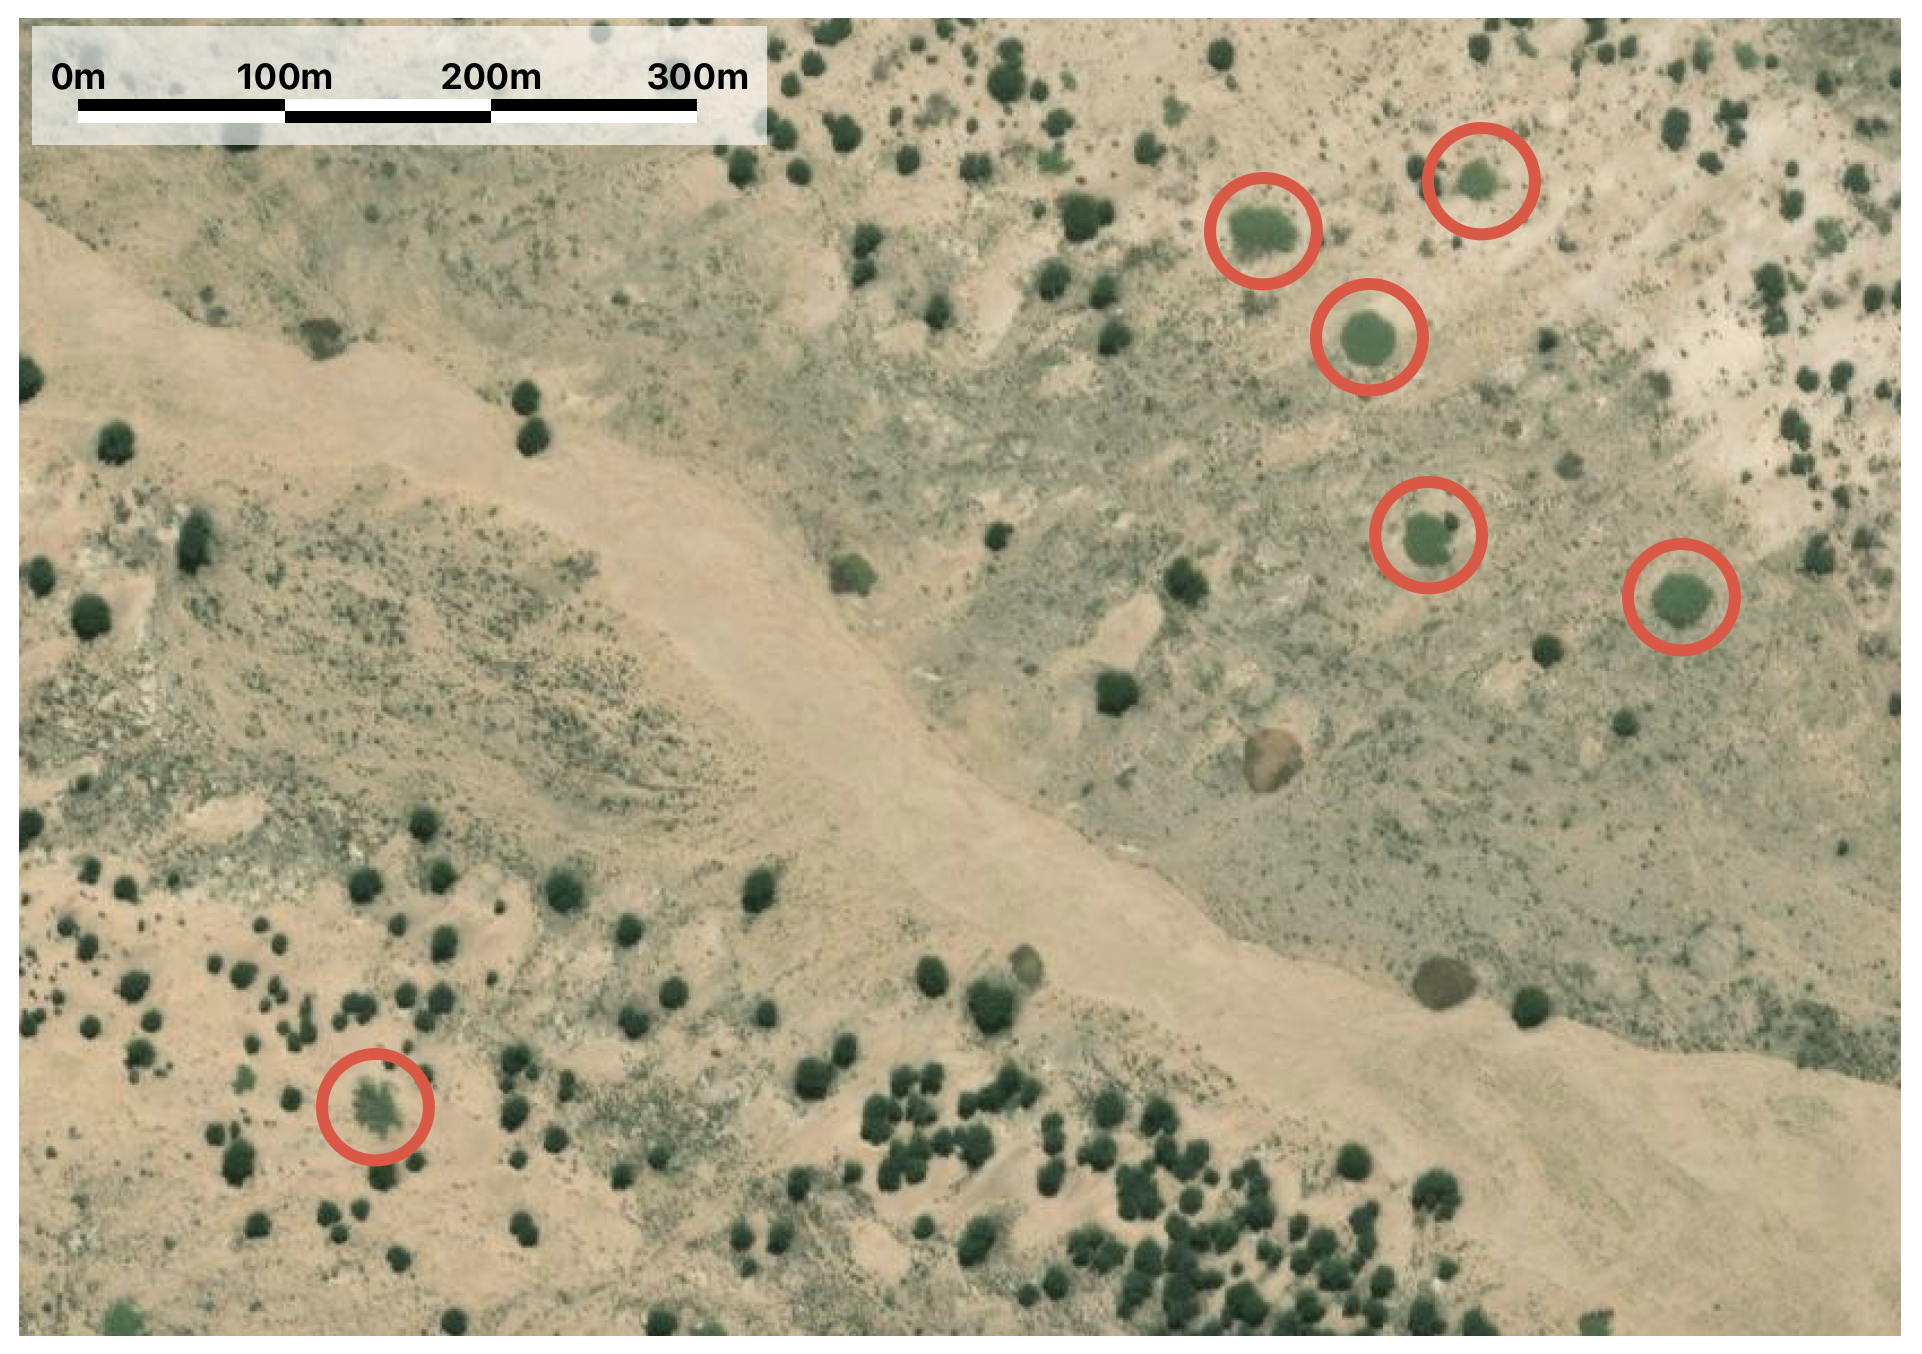
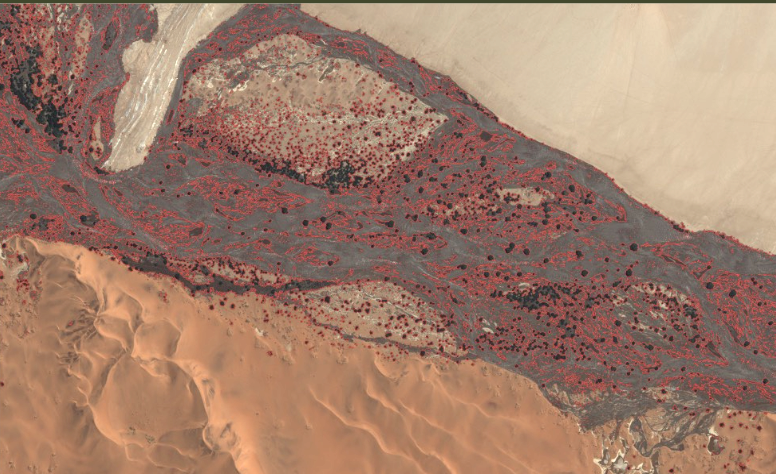
This analysis relies on computer vision algorithms. As such, it is critical to identify what !nara plants look like in satellite imagery. The following satellite image shows the Namib Desert region with one such ephemeral river channel containing both trees and !nara plants. The two can be visually distinguished in multi-spectral satellite imagery by a few key distinguishing features. The low-lying !nara plants tend to be spaced apart and irregularly shaped, whereas the trees include various sized circular features that tend to be smaller in size and are found in more widely distributed clusters. Additionally, in this image, the !nara appear a slightly lighter shade of green than the trees.
Climate Indicators
A recent report from the Intergovernmental Panel on Climate Change (IPCC), published in 2021, outlines the most salient global climate change impacts. Within this report, a detailed chapter discusses the impacts of climate change on Africa in particular.
All regions of Africa are predicted to experience increased mean air temperatures and extreme heat events as a direct result of anthropogenic climate change. The region of study in this analysis includes the ephemeral river basins of Central Namibia, namely the Kuiseb River region, which in the IPCC report is designated West Southern Africa (WSAF). IPCC predicts the WSAF region will experience increased aridity and sustained drought, beyond other climate effects IPCC predicts for the continent.
This study employs a computer algorithm that was designed to quickly and accurately analyze high-resolution satellite imagery and map the geographic extents of the !nara melon, enabling the capture of data that was previously unavailable to researchers and policy makers who are interested in understanding the potential impacts of climate change in the WSAF.
Previous Methods & Challenges
Technical approaches to mapping !nara in previous studies involved labor-intensive techniques, including manually geotagging locations and reviewing imagery from small-scale drone flights. These methods, while functional, presented significant limitations in terms of time and scalability, ultimately leaving much of the !nara plant extent unmapped. In a previous study of livestock impacts on the distribution of !nara by Kerby et al. (2022), a combination of drone imagery and manual geotagging was employed. It was noted that large plants, such as !nara, are "logistically challenging to measure systematically, accurately, and efficiently,” which the authors overcame using drone footage. However, it is not feasible to map the entire extent of the plant over hundreds of square kilometers of data using drone footage alone. Therefore, employing an algorithm that processes satellite imagery, large swaths of imagery can be processed quickly and accurately to identify the distribution of plants in minutes rather than days or weeks of remote field work and complex post-processing.
We trained the computer vision algorithm for this study using sub-one meter resolution commercial satellite imagery. The algorithm was then applied to 54 images from 2011 to 2020 covering 1000 square kilometers and accurately identified over 13,000 nara melon clusters throughout the Kuiseb River delta. Relying solely on previous manual methods to identify !nara cluster extents would have been significantly more time intensive and challenging for the human eye alone to identify over large regional extents. A computational approach also provides consistent, predictable results and returns shapefile polygons which can be analyzed for size and dimension in addition to mapping temporal and spatial distributions.
Plain English Explainer for Using Computer Vision
The justification for utilizing computer vision in this application rather than manually scanning all imagery comes down to two factors. The first is the capacity of the computer to scan hundreds of square kilometers of imagery rapidly and thoroughly, identifying small plants while producing consistent and complete results. The second is the ability to determine and return not only a location but also a contour size — a shape rather than a point, enabling many of the analyses performed here regarding the size of the plant in addition to temporal changes in distribution.
Research Findings
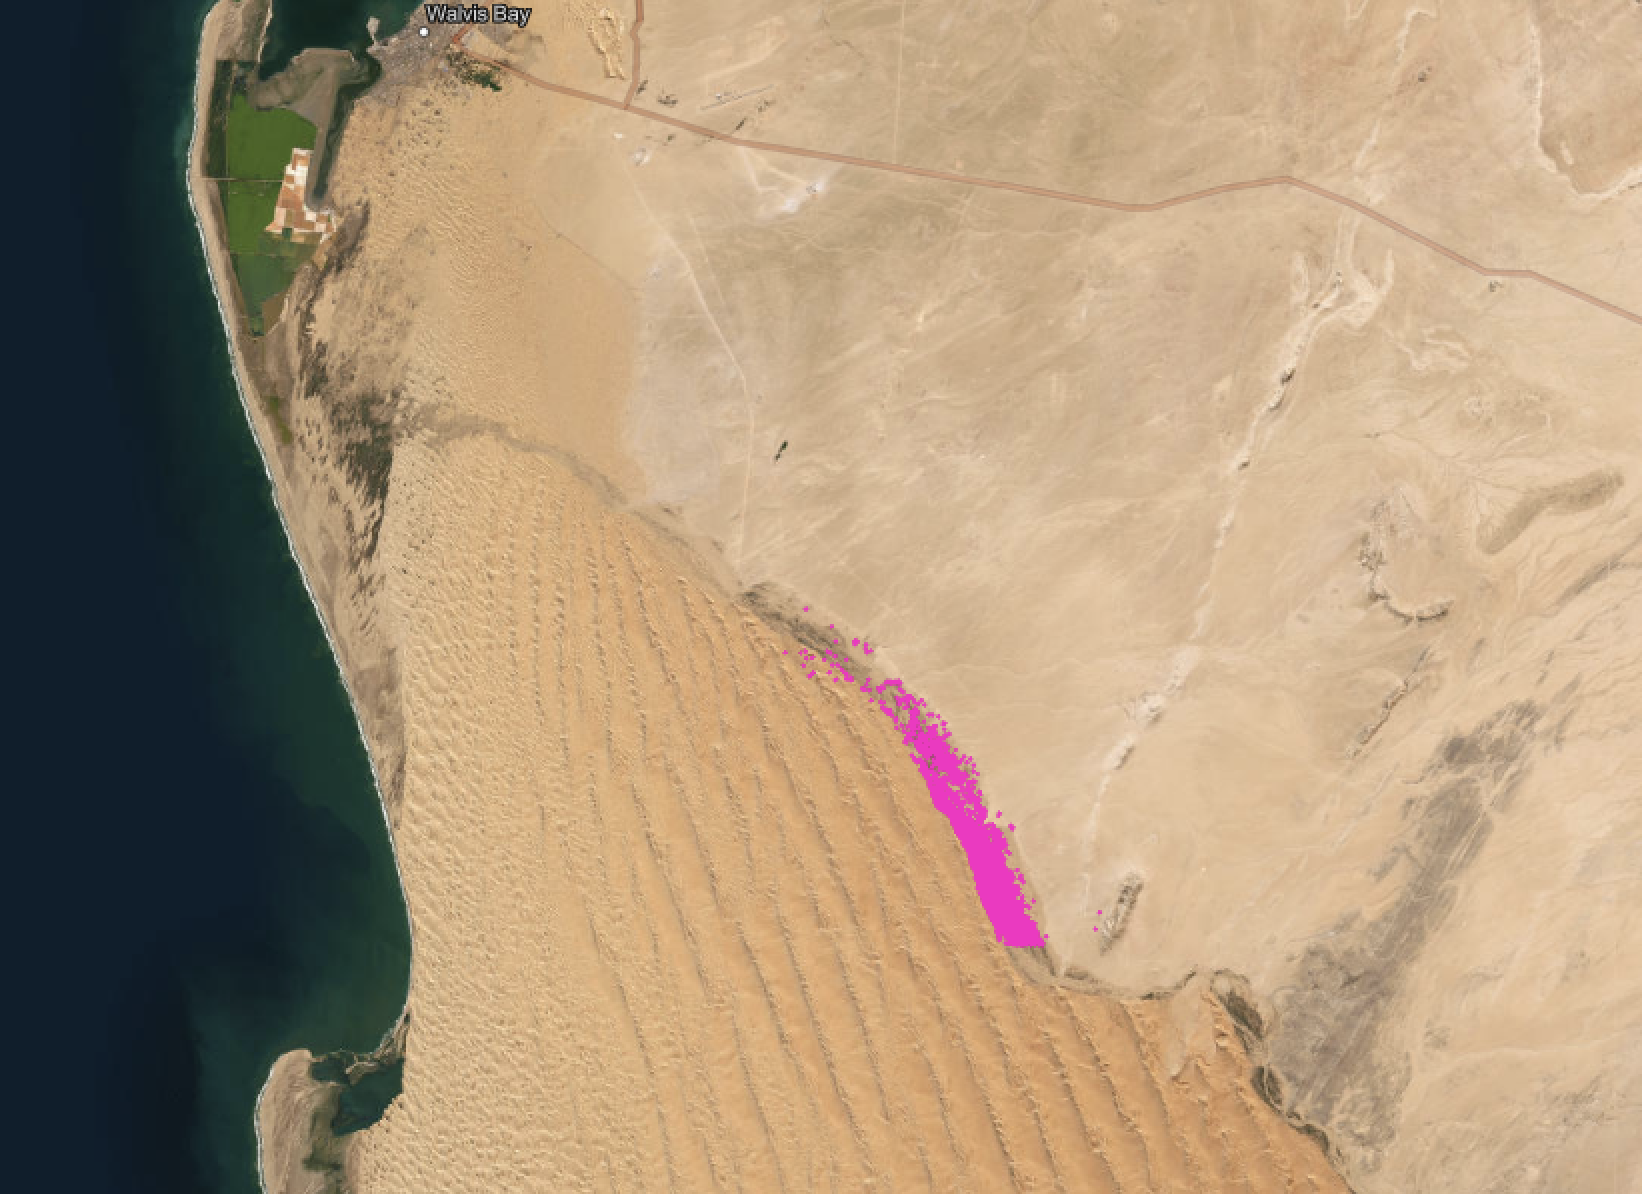
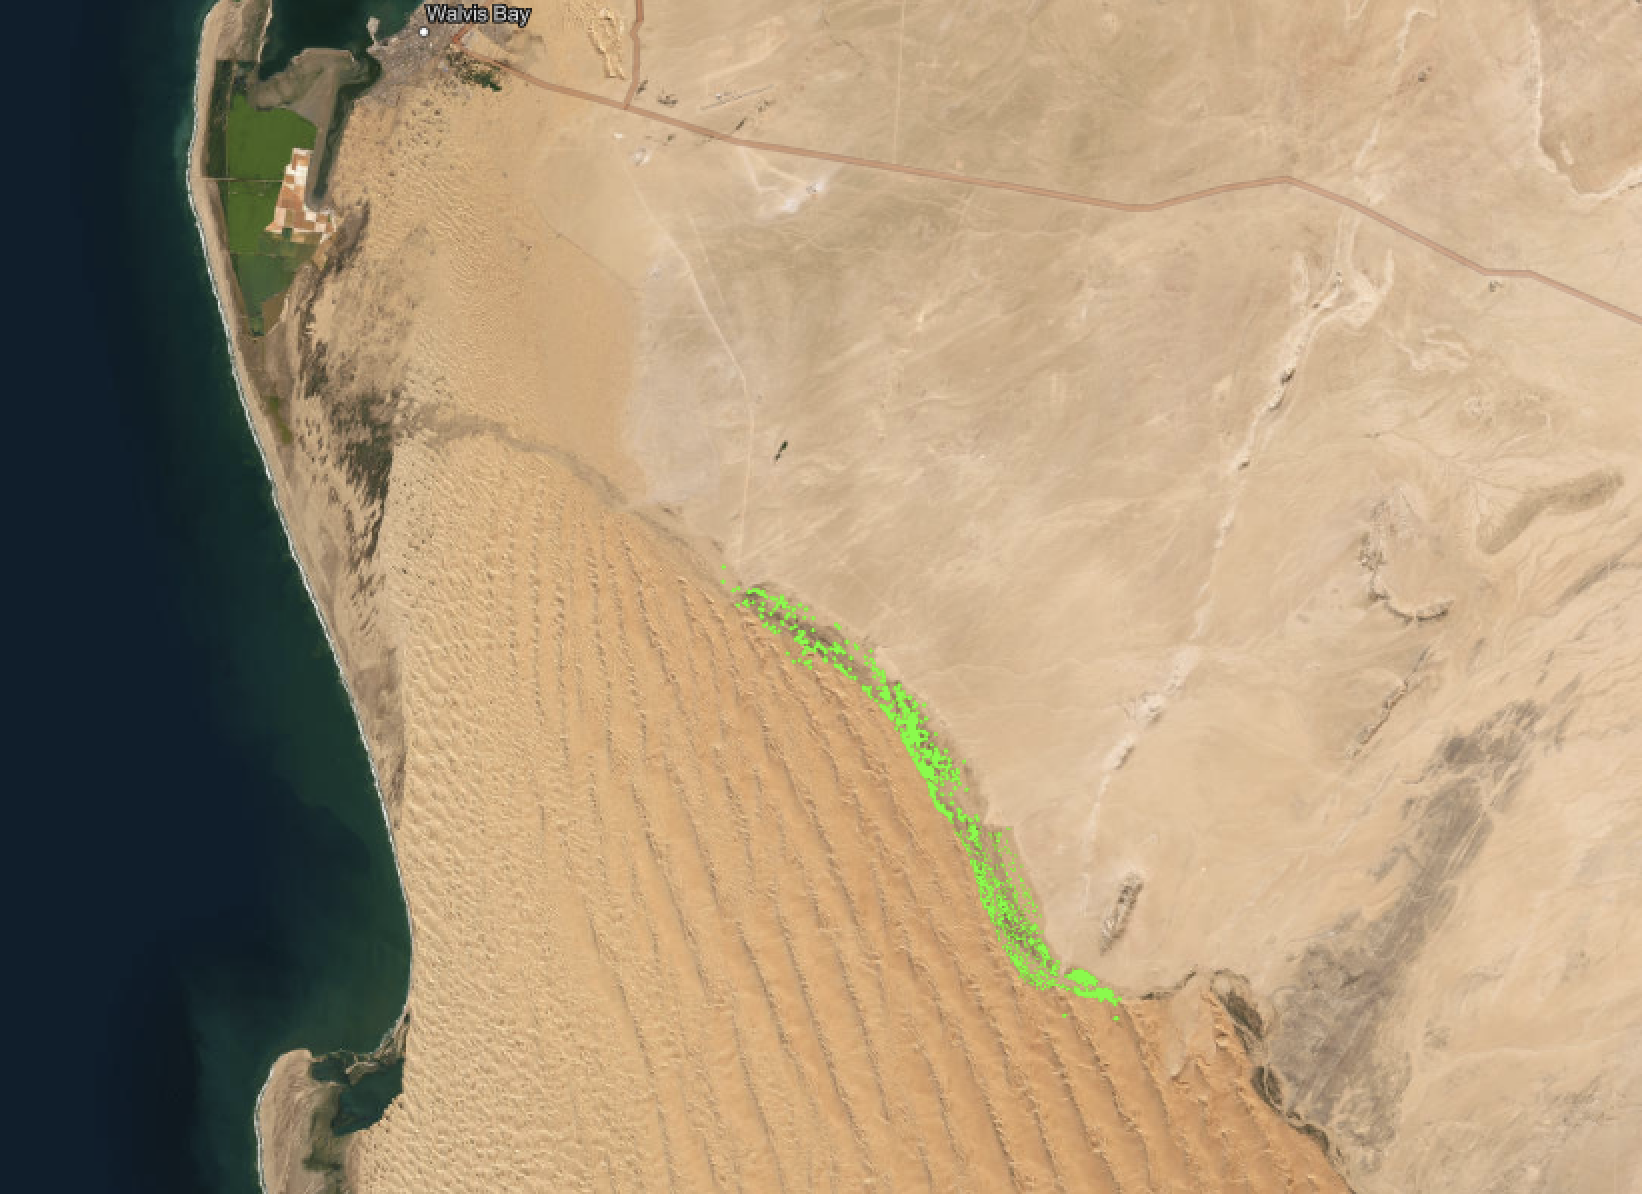
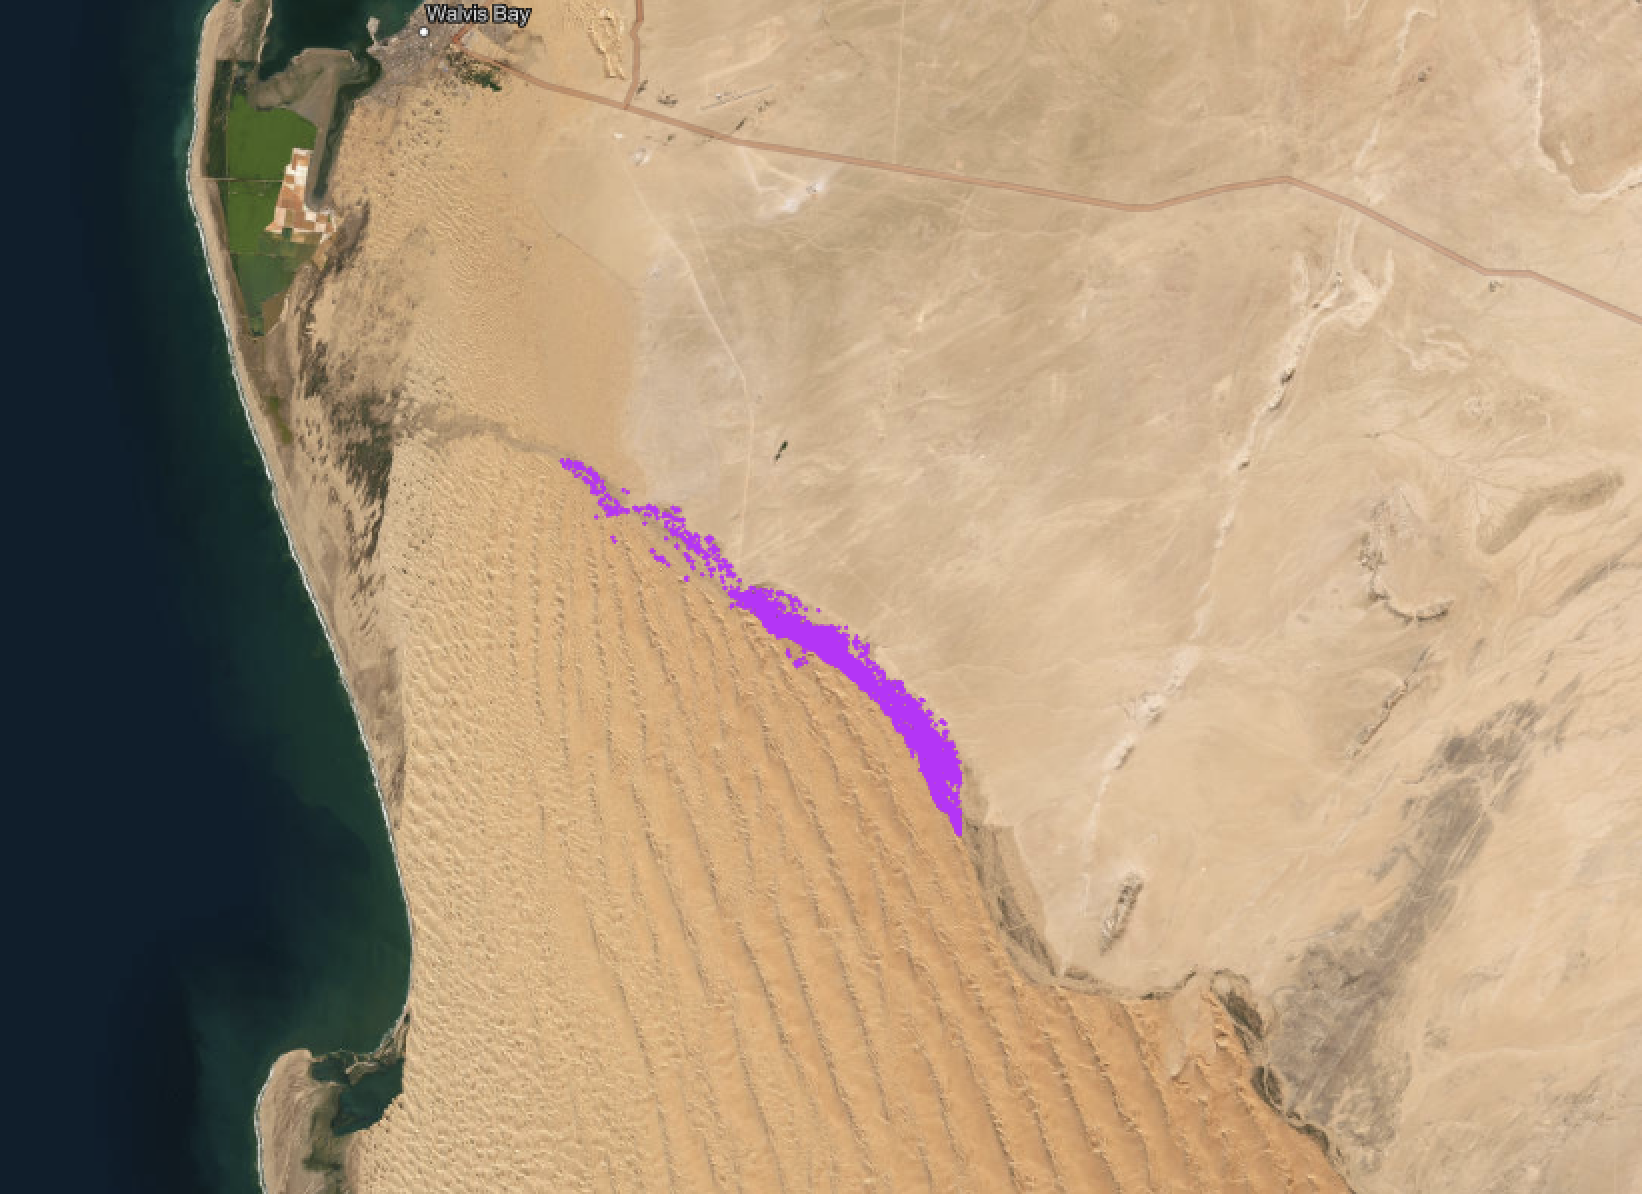
Analyzing a subsection of the delta region (see Area of Interest below), we conducted a number of different analyses on the data for each year of study to assess an area with overlapping data from each year to gather the most complete set of temporal data possible.
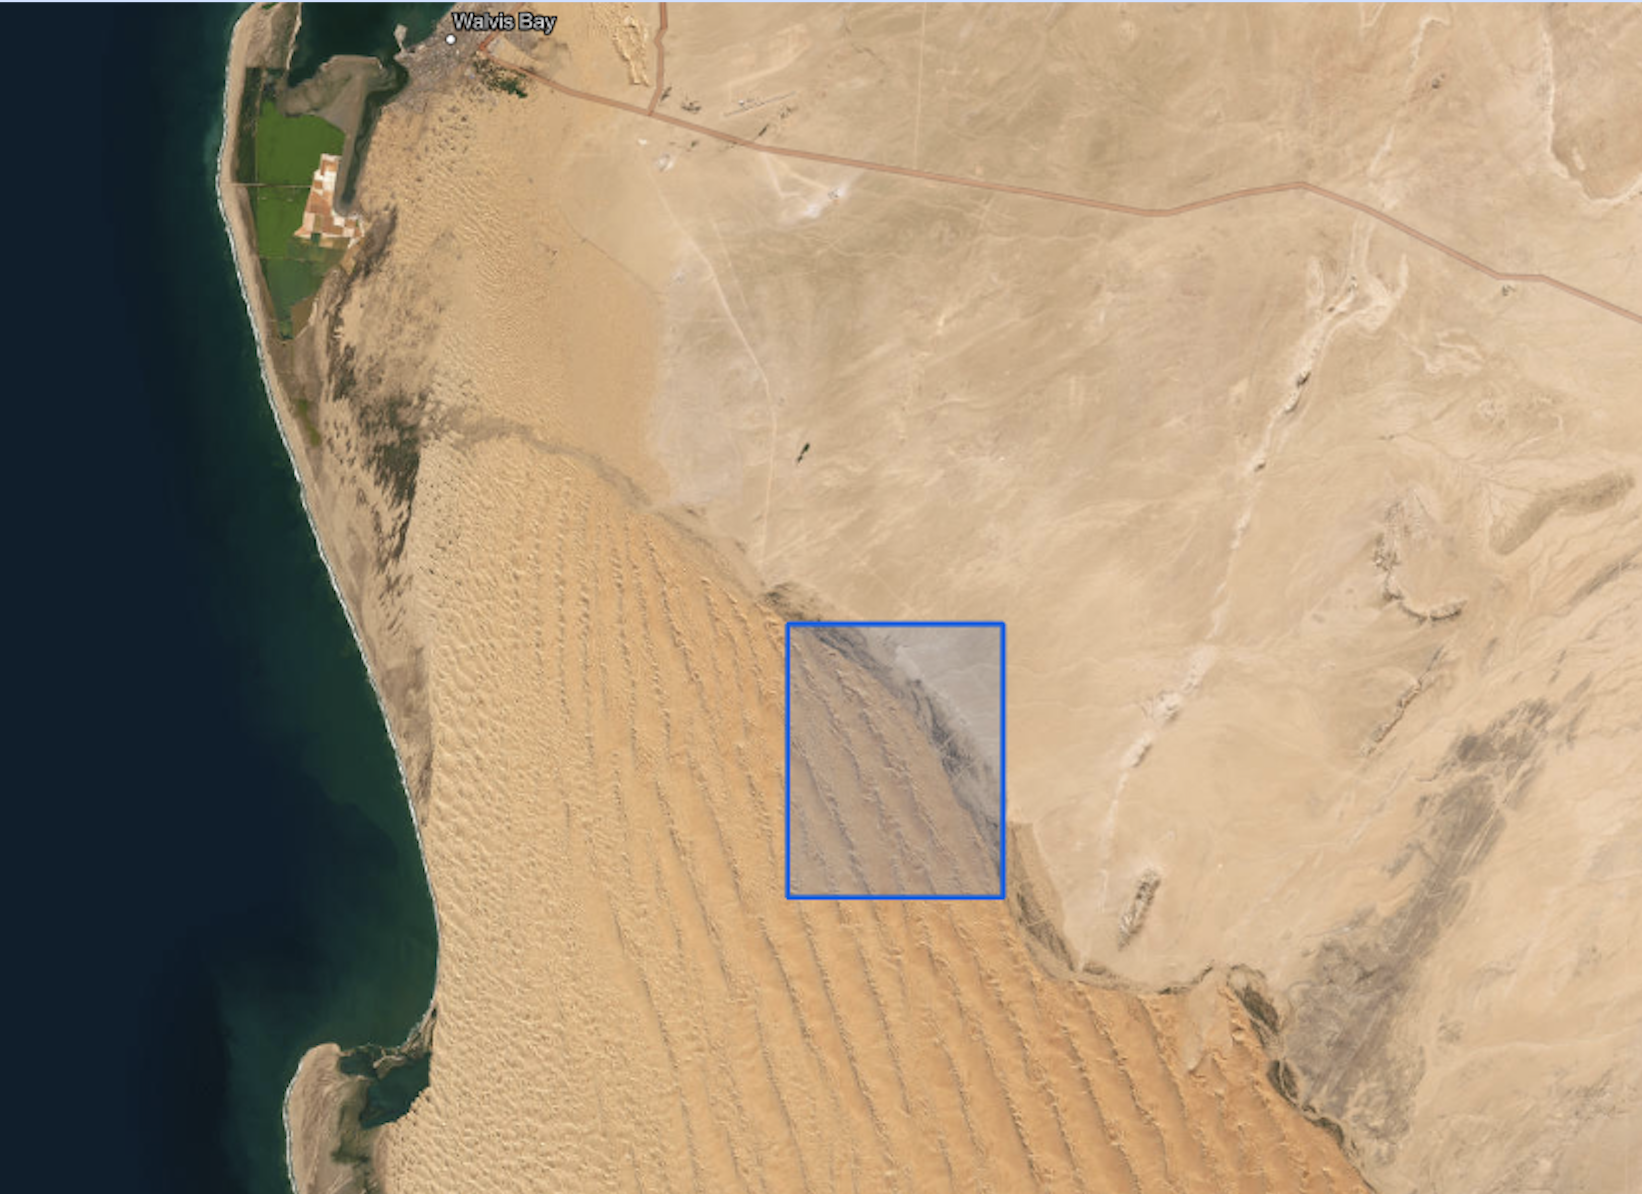
These figures show the extents of the data obtained via the algorithm for each year studied, with each polygon shape marking a cluster of !nara. Slightly different regions are covered by each year's available satellite imagery, shifting the extents from year to year. However, the region selected for this study was chosen because each year has data for that entire extent, thus allowing for comparison between years.
The impacts of significant rainfall and flooding can be seen over the years, as these images were taken between January and April, just after the rainy season of the indicated year. The more intense color-coding noted in the graphics below shows !nara growth.


Plant Counts & Area Coverage
The dramatic increase in !nara plant counts (Graph 1) and total area covered by !nara clusters within the area of interest (Graph 2) are both important results.
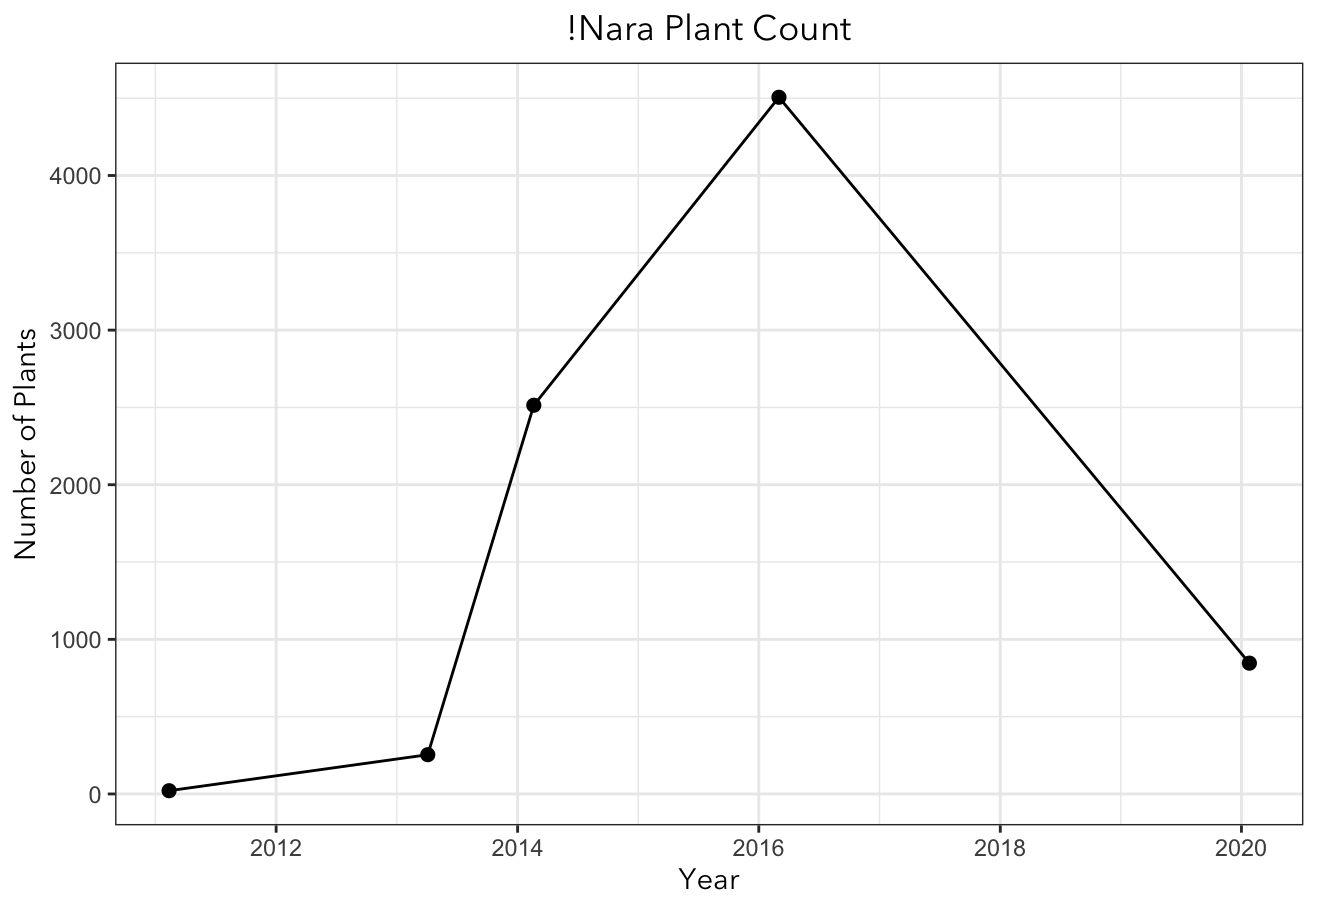
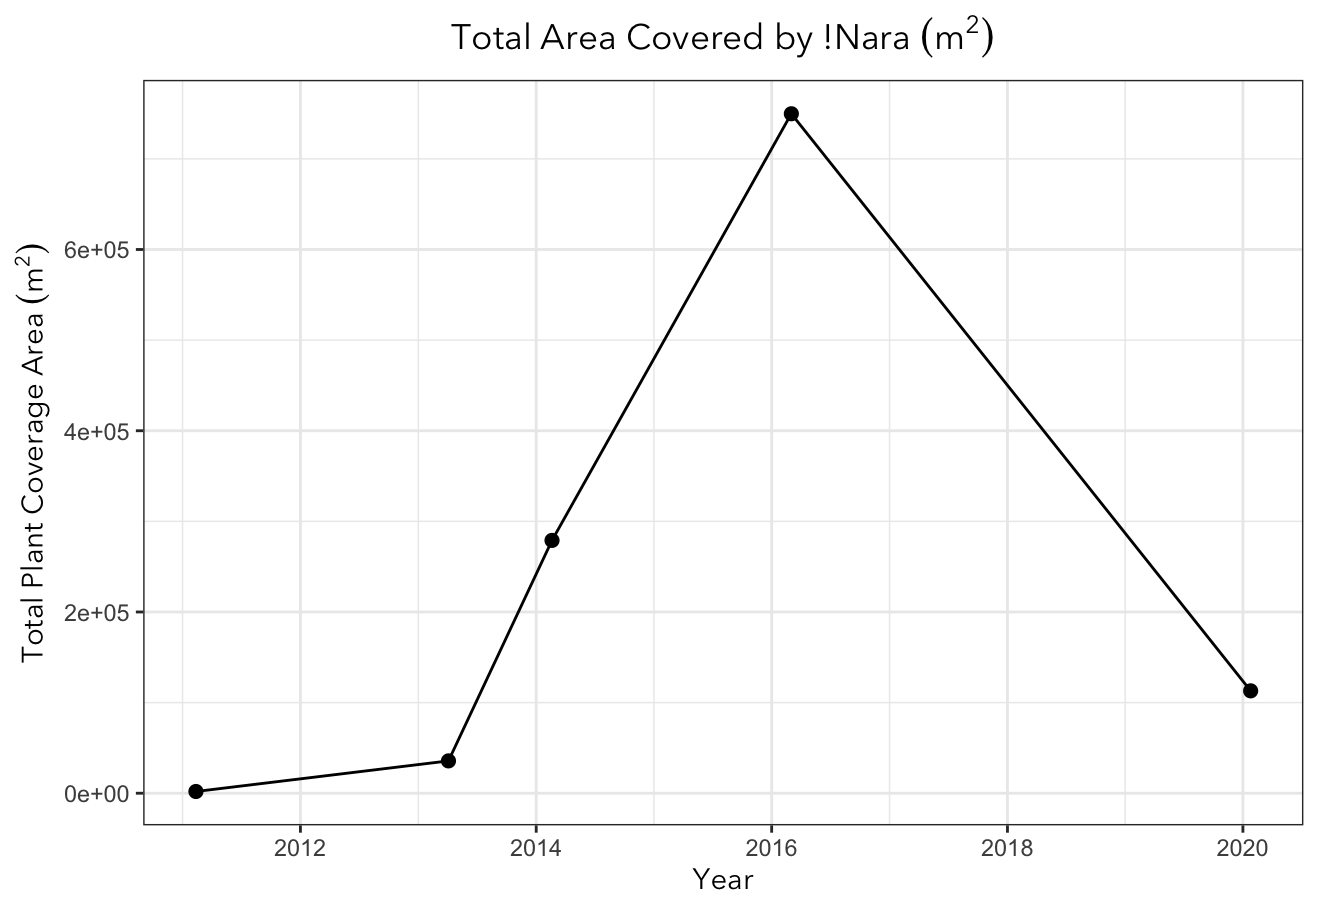
The count of !nara plants and the area covered by !nara plants follow similar trends, increasing steeply from 2011 to 2016 and decreasing in 2020. Both the count and coverage of !nara are sensitive to climate change, including rainfall and flooding.
Rainfall Effects
To study both the rapid increase from 2011 to 2016, as well as the decrease between 2016 and 2020, total monthly rainfall from December 2010 to June 2020 was plotted along with the number of !nara (Graph 3).
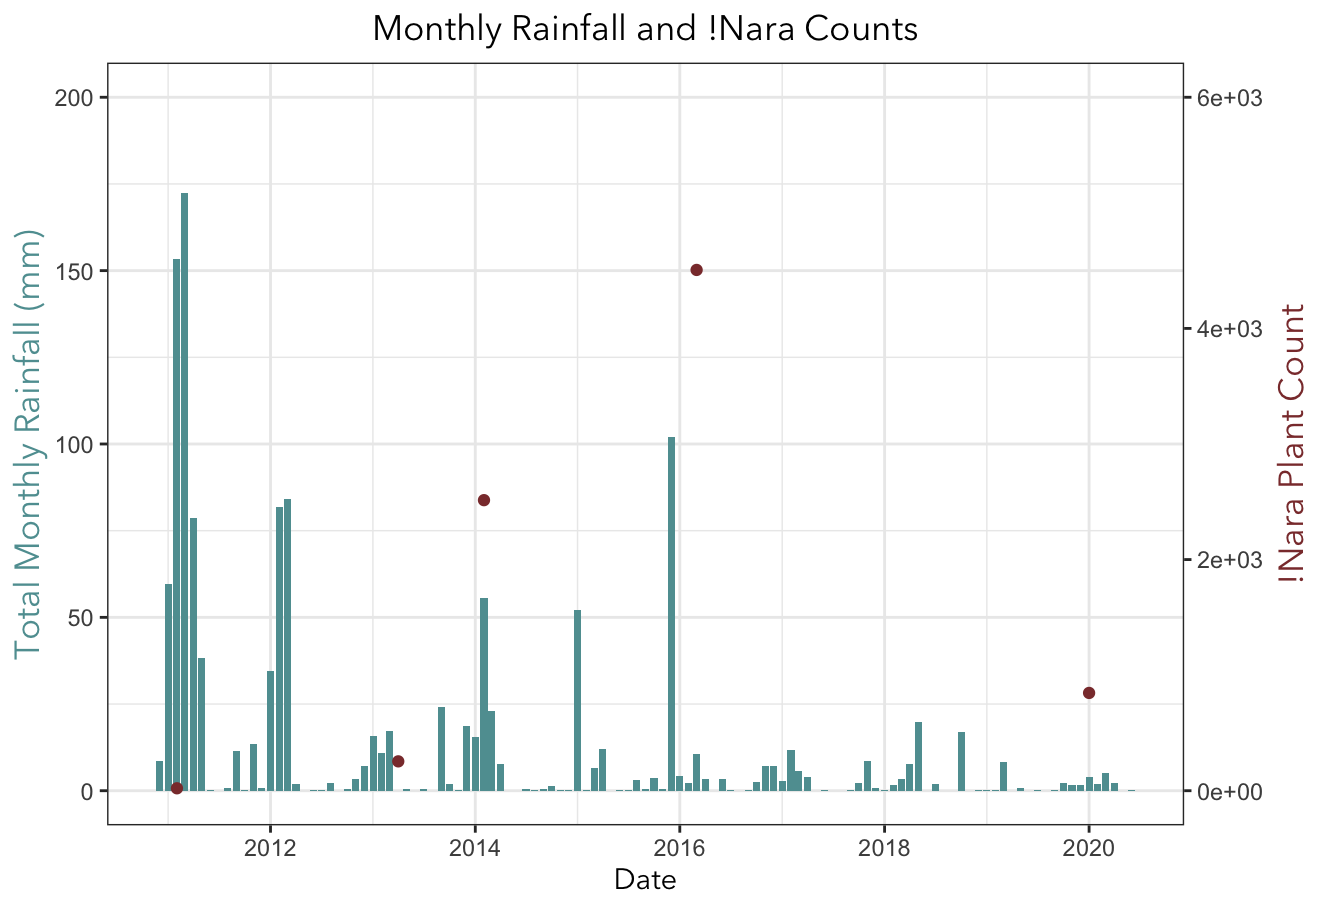
This results displayed in Graph 3 suggests that particularly large rainfall events, such as the flooding that occurred in 2011, may reduce the number of !nara present due to excessive sedimentation in the river channel. From 2016-2020, there was very little rainfall and periods of drought, which also appeared harmful to the !nara population, causing a massive reduction from 2016-2020.
If considering the use of the !nara plant population as a proxy for hydroclimate, we may suggest that the !nara population is directly dependent upon water availability up to a point. If excessive flooding occurs, it appears this direct dependency breaks down and the effects of large amounts of rainfall exceed the benefits provided to the plants via the water supply, causing a decrease in overall population levels despite an increase in rainfall. Therefore, it may be appropriate to use tracking of the !nara melon as a proxy for hydroclimate with the additional consideration of major flooding events wherein the river is actually carrying water at a sufficient level to deposit sediment in the delta region.
Mean Cluster Size
Another important finding from this analysis is a relatively unchanging mean cluster size of the !nara plant (Graph 4).
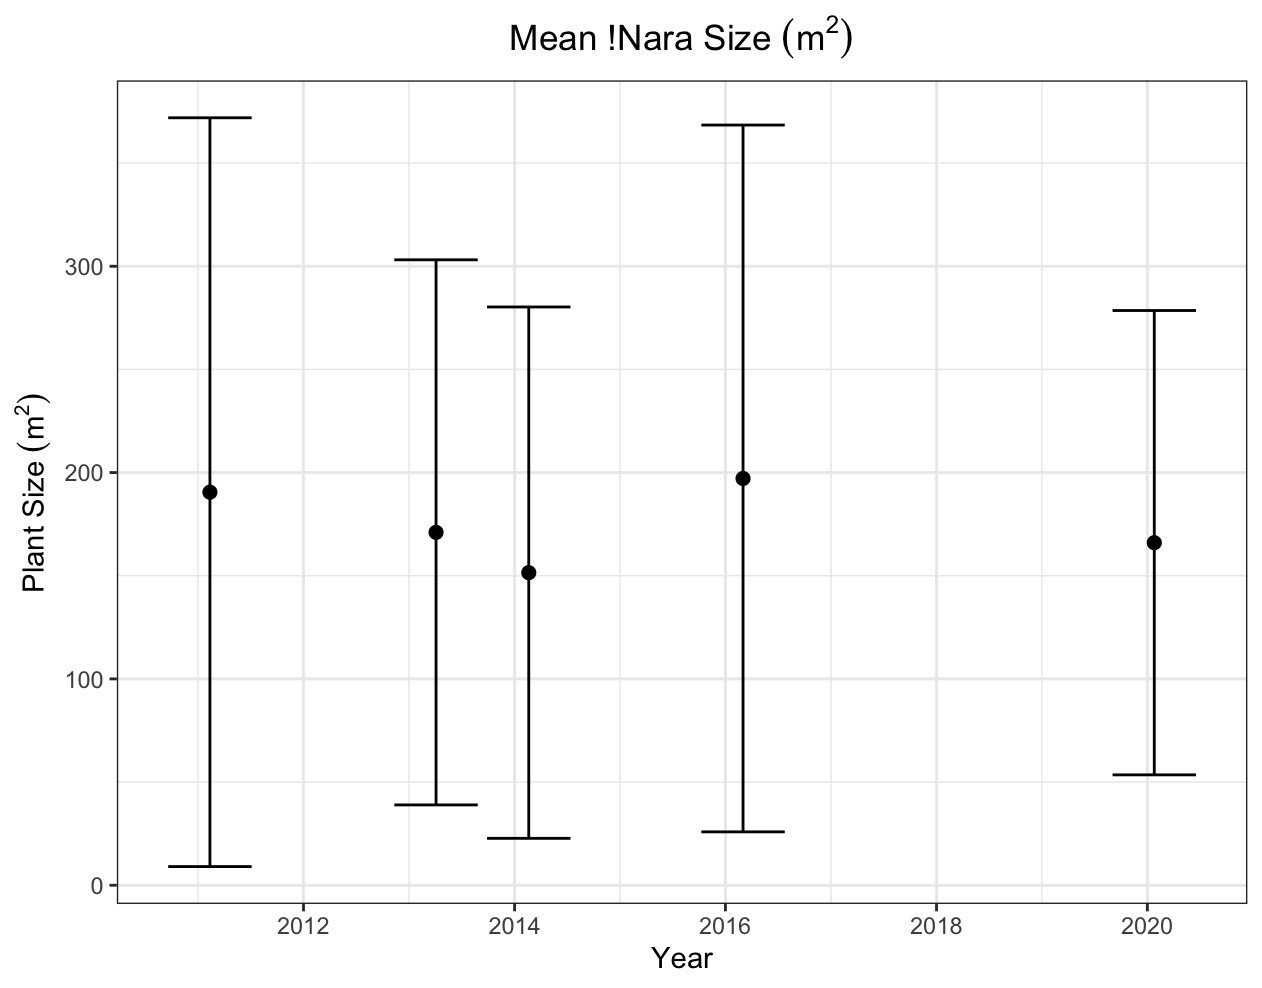
If it were simply regrowth that were causing the increase in total area and !nara cluster counts, we might expect there to be a trend in the mean cluster size (increasing from 2011 to 2016, in particular). However, there is not significant change in mean cluster size from 2011 to 2020, suggesting that we must consider that there were substantially fewer plants in 2011, although the plants that were present were not significantly smaller in size in 2011 than in later years. It may also be the case that the very large standard deviation of plant sizes (suggesting high variability and a wide range of sizes) shrouds the changes in mean plant size that may exist.
Technical Development Process
Segmentation
Image segmentation plays a crucial role in the performance of computer vision algorithms, particularly in complex tasks such as landscape analysis and vegetation mapping. The objective of segmentation is to partition an image into significant regions that are easier to analyze and process, leading to more accurate and meaningful information extraction. Our preliminary strategy in developing an efficient !nara finding algorithm was to move away from a pixel-by-pixel analysis and instead focus on the segmentation of regions within an image. This approach anticipated a reduction in computational complexity and an increase in the reliability of the extracted features.
To achieve optimal segmentation results, we needed a sophisticated technique that offered a balance between detail retention and segmentation efficacy. We refined our approach by adopting the contour finding algorithm from OpenCV — an open source library for Python that employs computer vision methods. This was utilized for edge detection and boundary tracing algorithms to delineate contours of distinct regions within each image. This method effectively highlighted the vegetation outlines against the sandy landscape, producing a cleaner and more representative mapping of the !nara distribution. By identifying edges and following their continuity, OpenCV’s contour finding enabled us to obtain a segmentation that was both coherent and relevant to our analysis.
Classification
After segmentation, each segment of the image is then classified to separate !nara from other image features such as trees and sand textures. Our implementation relies on a deterministic classifier that applies a series of two-band normalized difference threshold filters. After finding the average normalized difference values for Bands 7 and 1 and Bands 4 and 1 within !nara segments, we performed a series of sensitivity analyses for classifier thresholds around these values. This led us to our recommended normalized difference classifier ranges, which can be adjusted in the algorithm if necessary via a GUI, with code available via GitHub.
To generate the classifier, we used a set of training data. Given this training data, we calculated the mean and standard deviation of the median !nara segment band values, developing a band profile for the !nara melon, then compared this to profiles of other features.
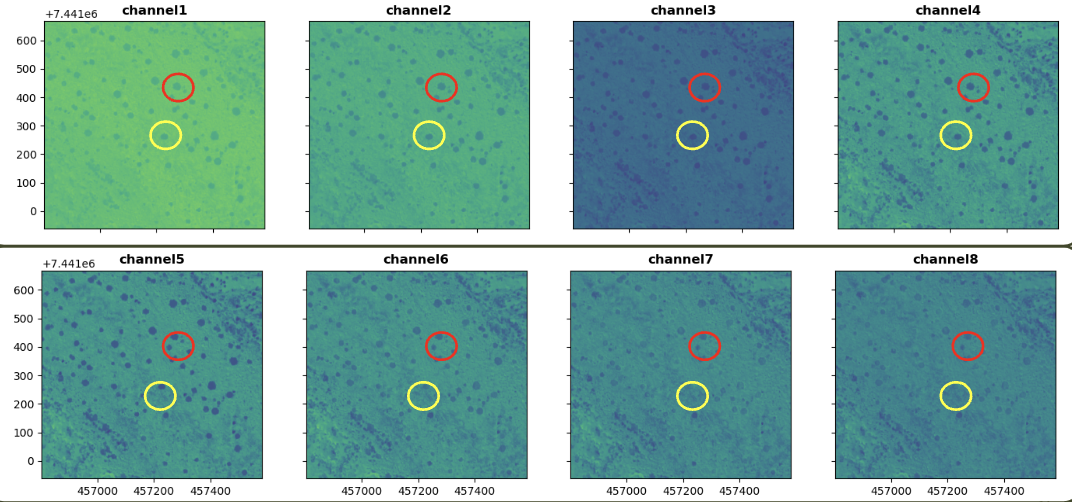
We found Band 1 to remain similar across all features. To account for differences in overall reflection intensity and angle across different segments of !nara, we used the normalized difference ratio between Bands 4 and 1 and Bands 7 and 1 to classify segments as !nara or non-!nara.
Metrics
We evaluated the performance of the algorithm using the technical metrics of precision and recall. Using the recommended classifier settings, our algorithm has an 84% precision and 45% recall rate. From a sensitivity analysis of these values, we found both were stable within a range of 10% of our recommended value and small perturbations in the input did not yield significant change in the output metrics.
Contributor Notes
The primary authors developed this analysis with a team of engineering students at the Thayer School of Engineering at Dartmouth: Luc Cote, Elise Donovan, Dylan Lawler, and Kendall Weingart. Special thanks to faculty advisors Prof. Xiaoyao Fan, Prof. Jonathan Chipman, and Prof. Sol Diamond.
References
- A. Mirzabaev, L.C. Stringer, T.A. Benjaminsen, P. Gonzalez, R. Harris, M. Jafari, N. Stevens, C.M. Tirado, and S. Zakieldeen. Climate Change 2022: Impacts, Adaptation and Vulnerability, chapter Cross-Chapter Paper 3: Deserts, Semiarid Areas and Desertification, page 2195–2231. Cambridge University Press, Cambridge, UK and New York, NY, USA, 2022.
- Kapuka, A., & Hlásny, T. (2021). Climate change impacts on ecosystems and adaptation options in nine countries in southern Africa: What do we know? Ecosphere, 12(12). https://doi.org/10.1002/ecs2.3860
- NASA Earth Observatory. (n.d.). Flooding in northern Namibia. https://earthobservatory.nasa.gov/images/49842/flooding-in-northern-namibia
- Shikemeni, N. (2023, April 24). Uses of the !Nara plant in Namibia. Gondwana Collection: Namibia. https://gondwana-collection.com/blog/uses-of-the-nara-plant-in-namibia
- World Bank Climate Change Knowledge Portal. (n.d.). https://climateknowledgeportal.worldbank.org/country/namibia/climate-data-historical
- Walvis Bay, Erongo, NA Climate Zone, Monthly averages, Historical weather data. (n.d.). https://weatherandclimate.com/namibia/erongo/walvis-bay
- Mizuno, K. & Yamagata, K. Vegetation Succession and Plant Use in Relation to Environmental Changes Along the Kuiseb River in the Namib Desert. African Study Monographs, Suppl.30: 3-14, March 2005 https://www.researchgate.net/publication/32171262_VEGETATION_SUCCESSION_AND_PLANT_USE_IN_RELATION_TO_ENVIRONMENTAL_CHANGES_ALONG_THE_KUISEB_RIVER_IN_THE_NAMIB_DESERT
Dec 15, 2022
2022 Major Flooding Event
Major precipitation events again caused substantial flooding in late 2022.Jan 11, 2021
2021 Major Flooding Event
Major precipitation events again caused substantial flooding in early 2021.Jan 25, 2020
2020 Satellite Imagery Collection
The date on which 2020 satellite imagery data was collected.
Mar 02, 2016
2016 Satellite Imagery Collection
The date on which 2016 satellite imagery data was collected.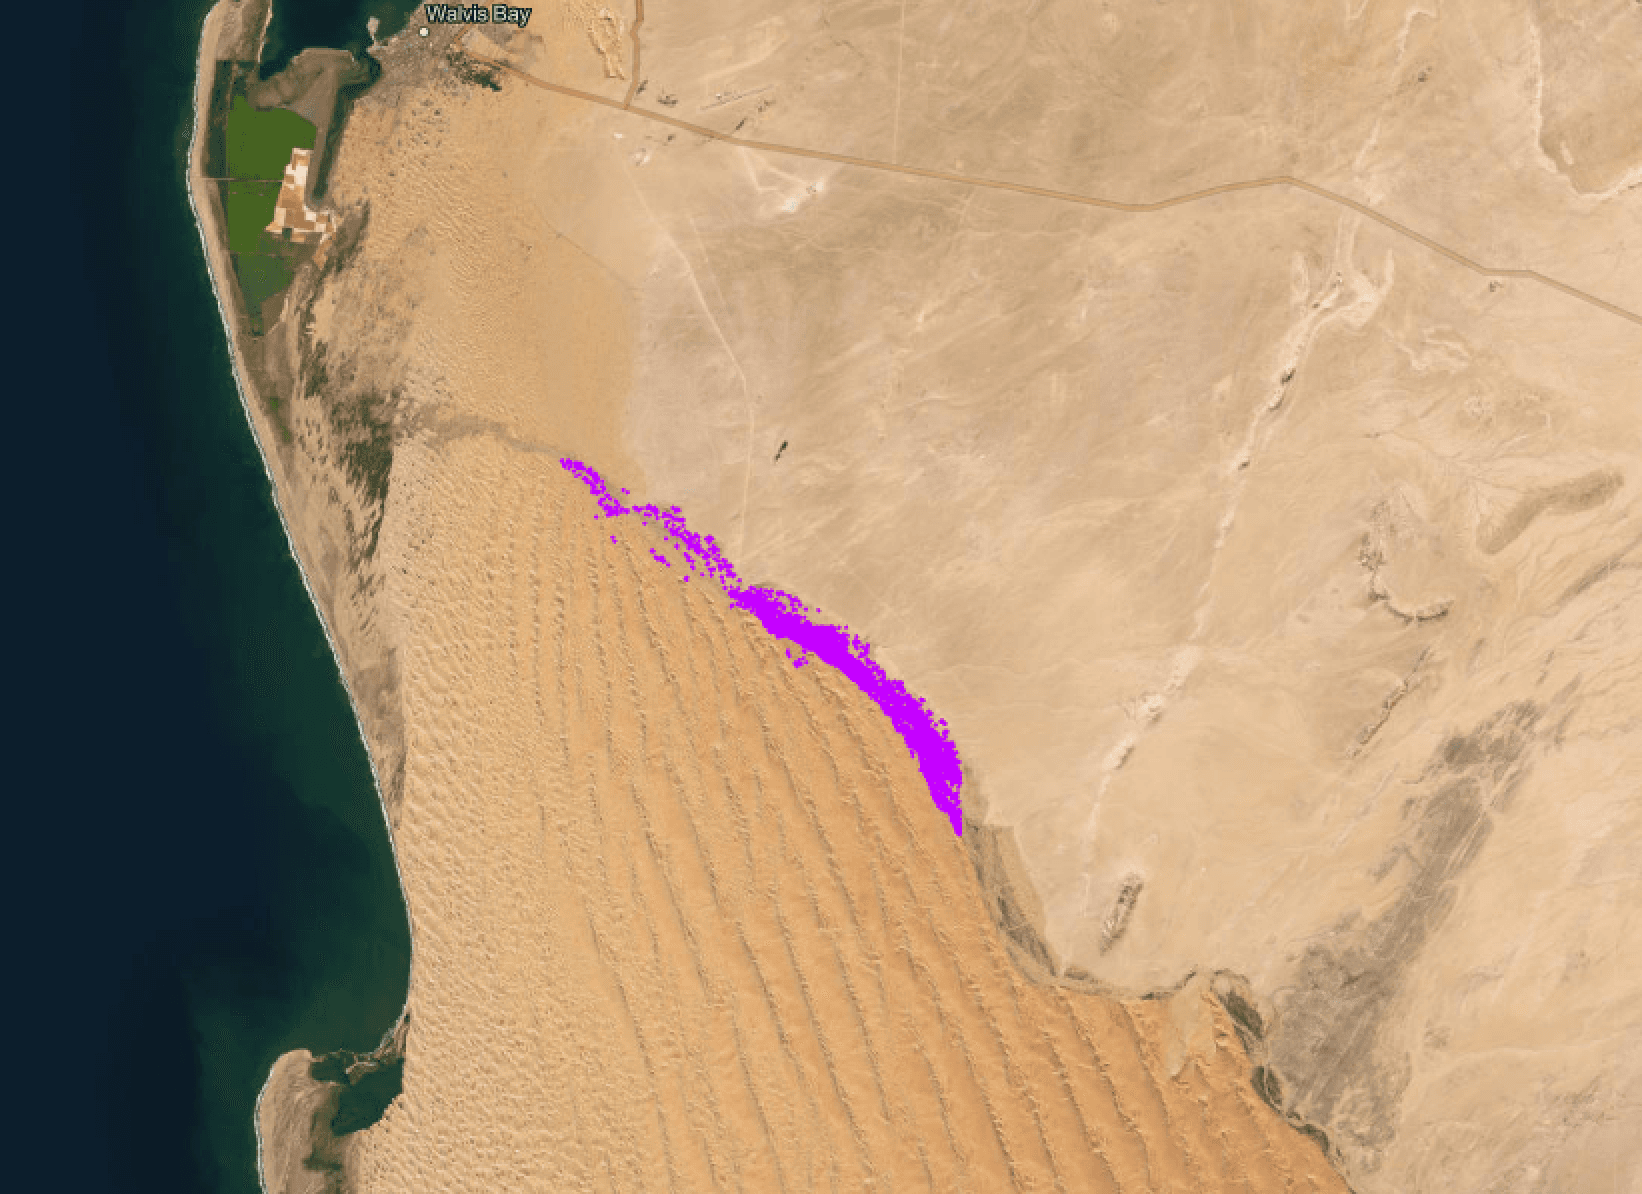
Feb 19, 2014
2014 Satellite Imagery Collection
The date on which 2014 satellite imagery data was collected.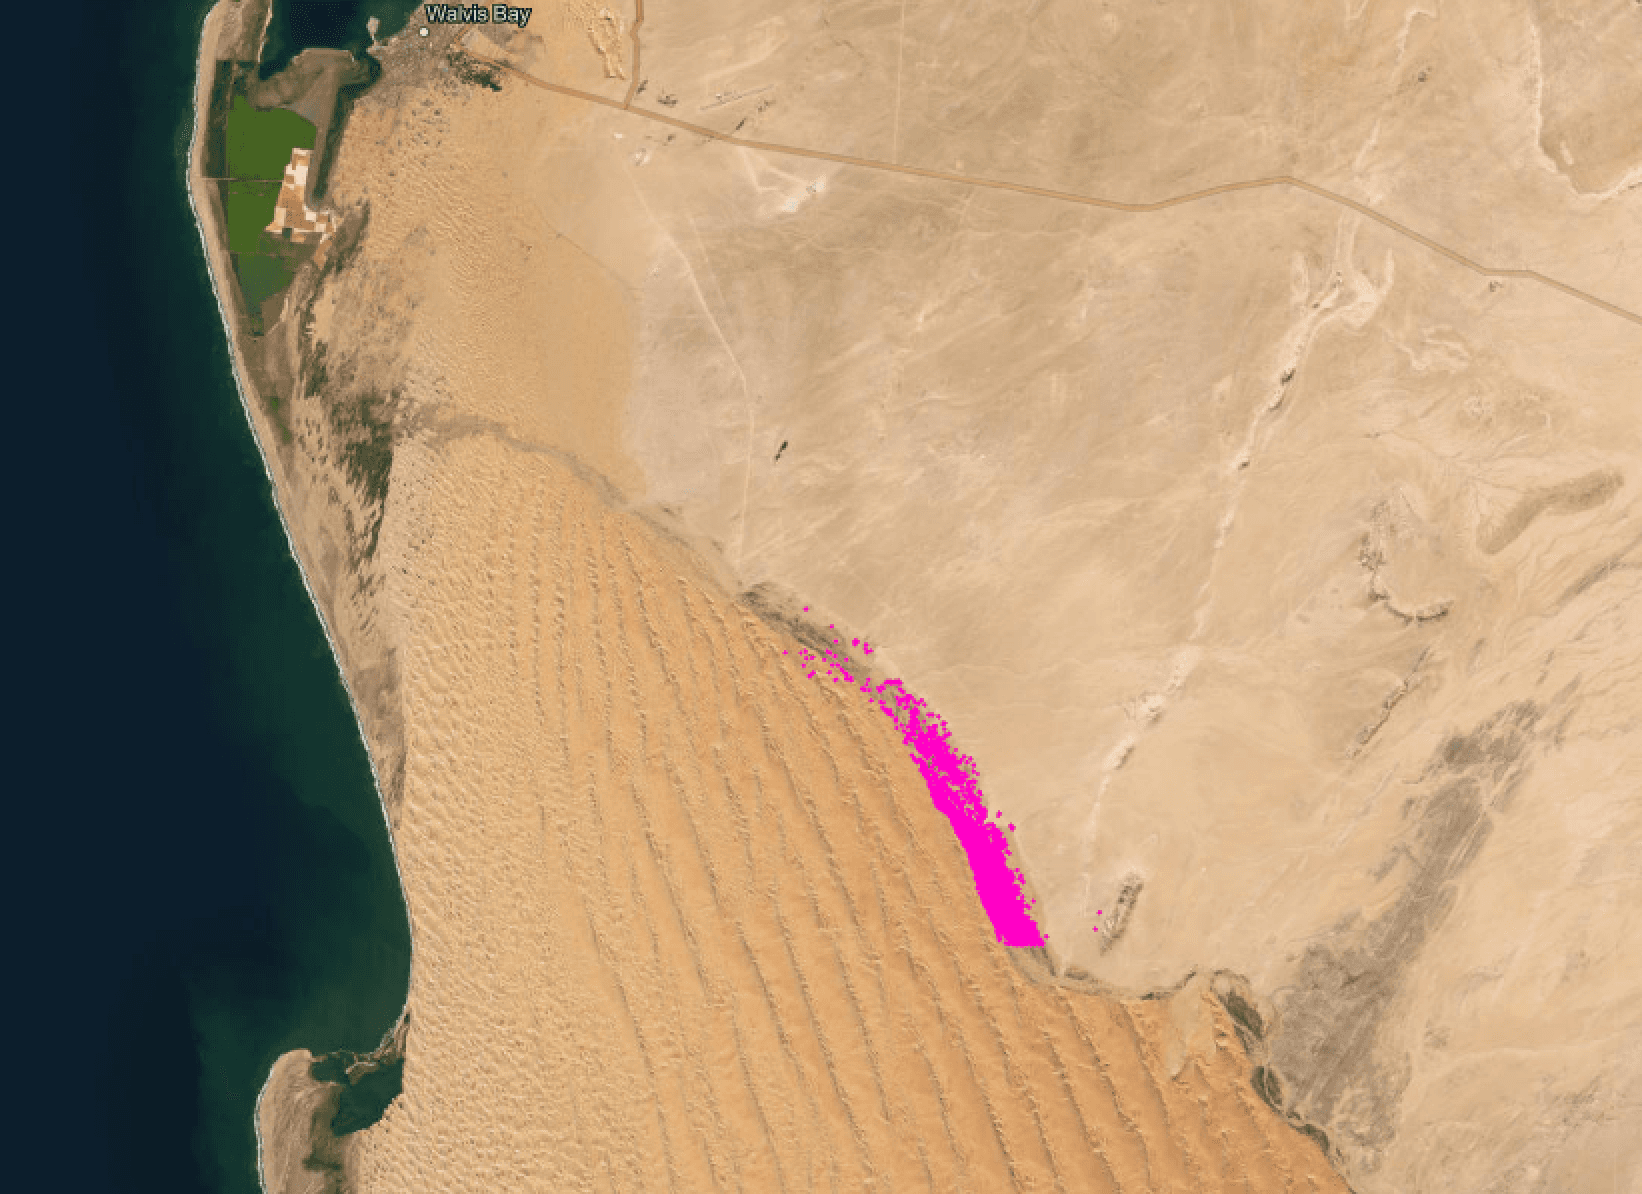
Apr 04, 2013
2013 Satellite Imagery Collection
The date on which 2013 satellite imagery data was collected.
Feb 11, 2011
2011 Satellite Imagery Collection
The date on which 2011 satellite imagery data was collected.
Jan 01, 2011
2011 Major Flooding Event
Major precipitation events in early 2011 resulted in the flooding of large parts of Namibia, including the Kuiseb


Look Ahead
Future work in the area of study should focus on the expansion of using satellite imagery to identify !nara on a broader temporal and spatial scale, potentially with the development of a record to track distributions over time for future analysis.
Things to Watch
- Refinement of the methods of determining change in size of !nara plants between years to more accurately measure growth rates and population dynamics.
- Similar studies of other ephemeral river channels in Namibia and the !nara populations within them in response to similar flooding events.
Data Sources
About The Authors
Undergraduate, Dartmouth College

Emily Monroe is the director of Dartmouth's Cook Engineering Design Center, which brings engineering students together with industry and non-profits to design and build engineering tools and analyses.

Methodologies Reviewed by NGA
Publication of this article does not constitute an endorsement of the contents, conclusions, or opinions of the author(s). The published article’s contents, conclusions, and opinions are solely that of the author(s) and are in no way attributable or an endorsement by the National Geospatial-Intelligence Agency, the Department of Defense, the United States Intelligence Community, or the United States Government. For additional information, please see the Tearline Comprehensive Disclaimer at https://www.tearline.mil/disclaimers.