Overview
This product demonstrates increased activity in Russia's civil aviation industry since 2017, despite the effects of the COVID-19 pandemic and ongoing international sanctions implemented following Russia's 2022 escalation of armed conflict in Ukraine. The author's analysis provide imagery-driven insight into the impact of those sanctions and the global pandemic by assessing the development patterns of Russian airports from 2017 to present day (2024).
Observations of the Russian civil aviation industry suggest an aggregate increase in activity, despite health concerns from COVID-19 and strategic sanctions intended to negatively impact civilian aviation infrastructure. Imagery and open-source information analysis show construction projects increased in all Russian military districts between 2017 and 2024 except for the Western district. Demolition, deconstruction, and project infrequency decreased in this same period.
Activity
In recent years, the Russian Civil Aviation Industry (RCAI) has faced challenges due to a combination of factors, including the Coronavirus Disease 2019 (COVID-19) pandemic and economic sanctions imposed by western countries. Russian operations within Ukraine and the escalation of that conflict in 2022 led to economic sanctions against Russia. These sanctions have created financial constraints, market isolation, and access to technology and components for the RCAI.[1] Without the effects of the COVID-19 pandemic or the ongoing issues stemming from the invasion of Ukraine, the primary challenges to the RCAI would be maneuvering foreign aircraft purchases, maintaining civilian aircraft manufacturing, and expanding international flights to new markets.[2] Although sanctions against the RCAI were discussed in 2014 following Russia's annexation of Crimea, only one state-owned and low-cost airline (Dobrolyot) actually faced EU sanctions. Though Dobrolyot was dissolved shortly after, the Russian government established a new low-cost airline, known as Pobeda, which still exists as of November 2024.[3] However, the ongoing challenges due to sanctions hinder the RCAI for several reasons. First, there is currently a widespread ban on Russian flights landing at US, UK, Canadian, and EU airports, international Russian flights are largely relegated to Turkey, Serbia, Belarus, and China.[4][5] Second, upon request of the Russian government, the RCAI retained aircraft leased from Western states after their legal owners requested their plans be returned. As of February 2022, 97% of passenger air traffic occurred via Western-manufactured aircraft.[6] Third, the RCAI is currently adapting to sanctions on imported aircraft parts from Western manufacturers, which impact Russia's majority-imported aircraft fleet. To navigate this issue, Russian airlines are cannibalizing parts and sourcing illicitly made aftermarket parts from unauthorized manufacturers.[7][8] For example, S7 Airways sourced parts from Turboshaft, a company based in the United Arab Emirates, accounting for USD 1.5 million in parts between February 2022 and May 2024.[9] However, this only accounts for part of S7's pre-invasion part imports of around USD 100 million per month, which fell to under USD 25 million per month as of April 2022.[10] Specifically, US sanctions prevent the importation of the following parts: engines and engine components, navigation systems, cabin pressure valves, cockpit displays, and landing gear.[11][12] S7 Airlines has stated its technicians have learned to repair Boeing 737 and Airbus A320 engines, as well as Honeywell auxiliary power units, allowing them to circumvent parts shortages.[13] Other aircraft components manufactured by US companies (such as Northrop Grumman) are procured by Russia through the use of intermediary states (China, the UAE, Turkey, Tajikistan, Kyrgyzstan).[14]
Methods
Editor's note: As of March 2024, Russian Military Districts have been reorganized. For the purpose of this report, the Northern Military District should be read as the current Leningrad Military district, and the Western Military District is now the Moscow Military District.
Planning
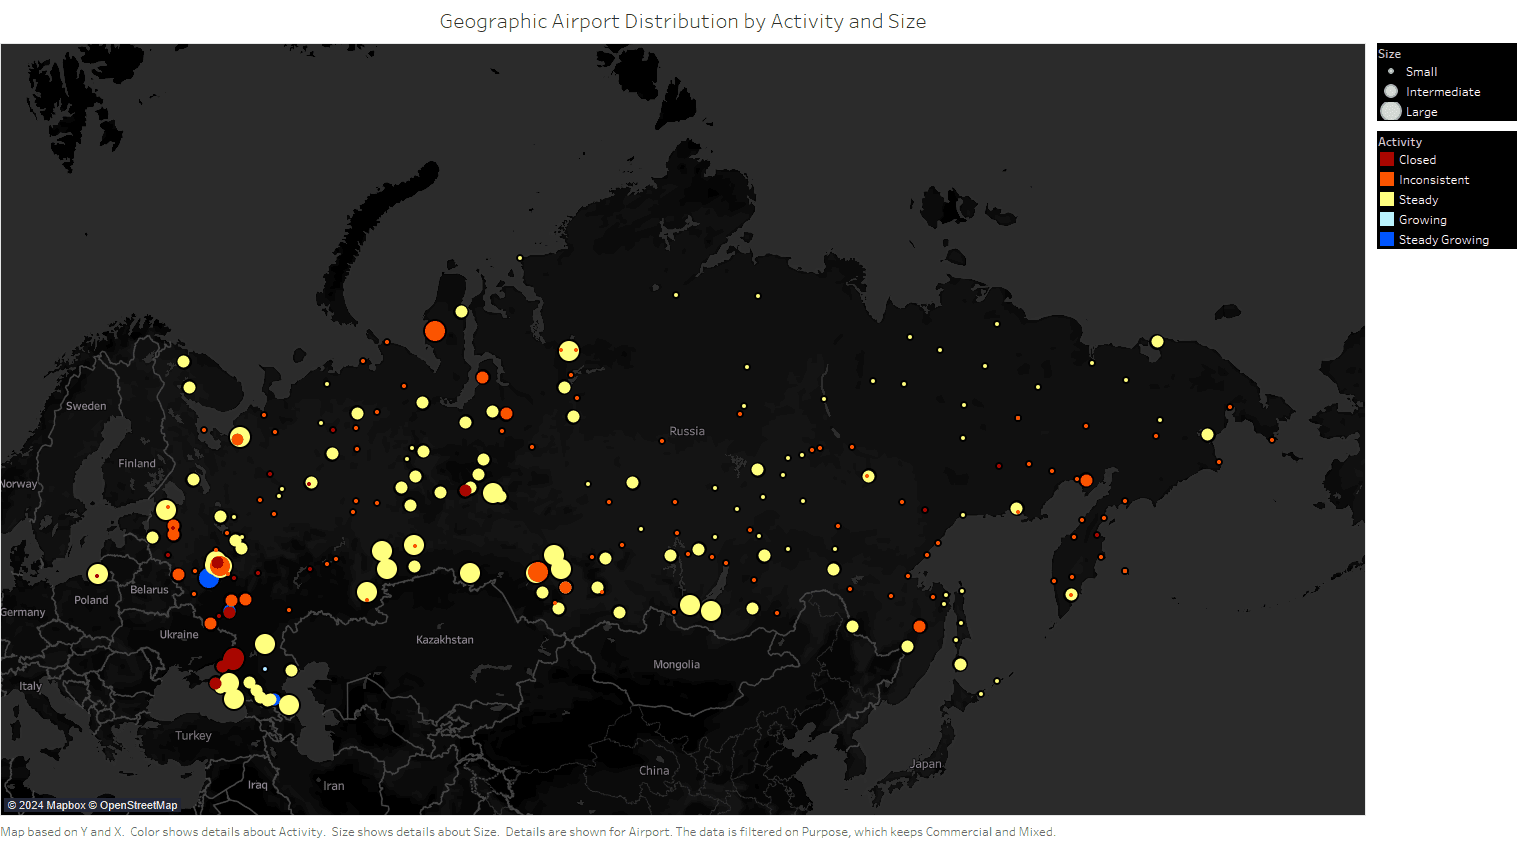
For the purposes of this product, 227 airports were chosen for review. These airports were recorded in 2018 as registered with Russia’s civil aviation authority Rosaviatsiya, or the Federal Air Transport Agency (FAVT).https://www.favt.ru/dejatelnost-ajeroporty-i-ajerodromy-reestr-grajdanskih-ajerodromov-rf/[15]https://www.fallingrain.com/world/RS/airports.htm[16] The Federal Air Transport Agency is responsible for funds allocations from the Russian government, adherence to industry and international standardizations, creation of relevant laws, as well as the United Air Traffic Management System of the Russian Federation.https://rg.ru/2015/09/01/aviadvijenie-site-dok.html[17] Sampling was limited to locations most likely to be impacted by federal policy changes. The 2018 list is the earliest available in the 2017-2024 analysis timeframe. 55 additional commercial airports not registered with the FAVT were added to the sample to represent geographic gaps and provide representation of a wider range of the Russian population. 34 personal and/or military use airports without commercial airline activity were filtered out of collection for a final sample size consists of 248 locations.
The 2017-2024 timeframe allowed analysts to establish a baseline of activity levels within the sample (2017 – Quarter 1 of 2020), account for potential effects of the COVID-19 pandemic (Quarter 2 of 2020 – Quarter 4 of 2021)https://pmc.ncbi.nlm.nih.gov/articles/PMC8365565/[18], and assess for potential effects of western sanctions following an increase in war efforts against Ukraine after February 24th, 2022 (Quarter 1 of 2021 – 2024).
Collection
Airports were geolocated and categorized by Russian military districts for workload distribution and grouping purposes only – there is no known correlation between the RCAI and Russian military districts. The terms district and region are used interchangeably throughout the product. Analysts collected, annotated, and analyzed imagery of each airport using the open-source imagery portals Google Earth, Maxar, and ESRI Imagery Wayback. A target goal of one image per quarter per airport (28 images per location) allows for a consistent read on the status of ongoing projects. Analysts collected supplementary open-source information to provide additional measurables for trend analysis. These measurables include purpose (commercial-only or mixed (commercial and military/personal craft)), scope (international or domestic-flights only), size (large, intermediate, or small – based on qualitative observations of overall property area, runway length, number of runways, runway apron, facilities present, etc.), and present-day activity level (steady, steady growing, inconsistent, or closed – based on qualitative observations of flight data, imagery, and open-source information).
Data Processing and Exploitation
Qualitative observations made during imagery analysis were codified as indicators for storage into a data matrix. Examples of positive indicators include building, runway, and miscellaneous project classifications. Negative indicators include demolition and degradation classifications. Each category has subclassifications including when the event was first noticed, if it appears ongoing, completed, was completed within one quarter, or showed no apparent progress. The full list of indicators can be found in the csvRussia's Airports Structured Datastructured data file.
To account for imagery gaps, inferences were made in some cases as to whether a project was put on hold or no project occurred (there is no observable change between the two available images), a project was advanced (there is observable change, but the project does not appear to be finished), further degradation occurred (there is further decay in integrity), and so on. All instances of project start or completion are notated when they are first noticed and are never inferred.
Potential imagery for all quarters totaled 7,936. Analysts collected and annotated 1,801 images during this project. Out of those images, 2,399 total indicators were observable. An additional 2,105 indicators are inferable, totaling the instance count to 4,504.
Tableau and ArcGIS visualization software were utilized to trim and exploit data for trend analysis. Measurable trends in data tables and charts were compared with Tableau. Maps for geospatial analysis were generated with Tableau and ArcGIS.
Discussion
Trend One: Climate Impacts on Projects
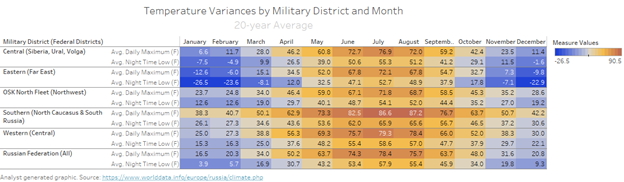
This project assessed climate data for variances between military districts that would impact project status and/or airliner activity. No significant differences were found to support climate as a key driver behind regional disparities in project status and/or airliner activity. Qualitative observations suggest that in areas with extreme cold climates, Russia relies on specialized airframes, including helicopters, to maintain operations without impact on activity.
On average, Russia experiences mild spring and summer seasons, with much colder autumn and winter seasons. Indicators, collected by calendar year quarter, allows for rough similarity with seasons: Q1 with winter (January, February, March), Q2 with spring (April, May, June), Q3 with summer (July, August, September), and Q4 with winter (October, November, December). The terms season and quarter are thus used interchangeably in this section.
The temperature variances by military district are based on the average of their constituent Russian federal districts. Because some military districts do not overlap exactly with federal districts, weather data may be affected by the different distribution of measurements.https://www.worlddata.info/europe/russia/climate-central-russia.php[19]
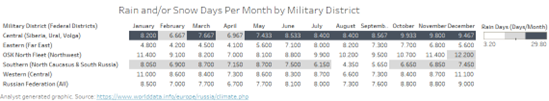
In reference to precipitation, the average snowfall has a 12:1 ratio with rainfall. For example, 12 inches of snow is equivalent to one inch of rain.https://www.weather.gov/arx/why_snowratios[20] For simplicity, analysts assume that in months with average temperatures below freezing, precipitation is snow.
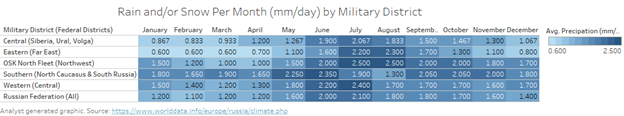
Rain / Snowfall Metrics by Military District
Western conditions: Moderately cold winters, mild summers. Precipitation is mostly steady year-round, but it increases in spring and early summer; however, the authors feel this is not enough to realistically affect airport activity.
- Winter: The large number of ongoing projects is likely due to less precipitation as compared to other seasons, despite colder temperatures. The lack of progress on those ongoing projects is likely due to said cold temperatures. Projects first being noticed and project completion are most likely smaller projects, or those that are not climate sensitive.
- Spring: Like winter, this quarter has one-third of projects showing no progress, likely because of lingering winter weather conditions. Most projects were first noticed in spring, coinciding with warming temperatures.
- Summer: Ongoing projects and project completion increased from springtime, likely because of warm temperatures. Over one-fourth of projects were first seen in the summer, again because of weather conditions. This increase is despite higher rainfall in the early and middle months of the season.
- Autumn: As with winter, the number of ongoing projects is steady due to a decrease in precipitation from earlier seasons. Cold temperatures may contribute to the single project not showing any progress.
Eastern conditions: Coldest average temperatures, especially in winter. Contrasted with mild summers. Low rainfall between winter and spring, slightly wetter in summer and fall.
- Winter: Over a fifth of ongoing projects occurred in wintertime, despite sub-zero average temperatures; this is likely due to the low amount of precipitation in the region. However, almost a fifth of total projects showing no progress were in this quarter (not ongoing), likely because of the sub-zero temperatures themselves.
- Spring: Over half of the projects were completed in springtime, coinciding with warmer weather. Likewise, almost half of projects were first noticed in spring, with construction restarting after cold winters. Spring also had a roughly equal distribution of projects completed within one quarter, projects with no progress, and ongoing projects.
- Summer: Like spring, summer saw over two-fifths of projects first noticed, again likely due to warm weather. Summer also had over half of projects completed in one quarter, most likely because of warmer temperatures.
- Autumn: As with winter, autumn saw over a fifth of ongoing project instances, again likely because of low precipitation. Similar to winter, freezing temperatures likely caused projects to show no progress. However, it also included almost a fifth of project completion within one quarter, likely to finish minor projects in preparation for winter.
Overall, the distribution of projects with no apparent progress remained relatively consistent across all quarters but for different reasons: colder temperatures in winter and autumn likely slowed activity, while smaller projects were often deferred to spring and summer. Similarly, the distribution of ongoing projects showed a steady pattern throughout the year. This consistency was likely due to the need to maintain construction schedules regardless of weather conditions to ensure airport operations remained uninterrupted.
OSK North Fleet conditions: Cold winters and mild summers. There is more precipitation than all other regions, especially between July and January- this means snow in the wintertime. Analysts did not incorporate any airports from Russia’s northern islands, such as the Novaya Zemlya and Franz Josef Land archipelagos, as they have little to no commercial activity or importance. This slightly affects the regional weather averages, as these northern islands were also excluded from regional weather averages.
- Winter: There were only ongoing projects. Sub-freezing temperatures and snowfall do not appear to halt construction but may slow progress down.
- Spring: Most project starts (three-fourths) were first noticed in this season, coinciding with warming temperatures. Similarly, springtime included two-thirds of project completion. This season also had the only instance of a project not showing any progress, likely a holdover from wintertime. Also, it had the only instance of project completion within one quarter; construction was likely held off until snow thawed.
- Summer: Over a third of ongoing projects occurred in this quarter; like spring, construction is not obstructed by warm temperatures. Summer also accounted for the last third of project completion, again aided by warm temperatures. It also accounted for a quarter of projects first noticed, primarily those that could be continued into cooler months.
- Autumn: Like winter, there were only ongoing projects, showing that colder temperatures and higher precipitation amounts likely do not halt construction.
Southern conditions: Hot summers. Mild autumns and winters, where the average daytime temperature does not drop below freezing. Precipitation is also higher than average, especially in spring and summer. Being the southernmost region, all average seasonal temperatures here are higher than other regions.
- Winter: This season accounted for nearly one quarter of ongoing projects, as opposed to other regions, where the number of ongoing projects tended to be lower in winter. This is likely due to milder temperatures. The same can be inferred for the higher-than-average number of projects completed in one quarter, project completion, and projects first being noticed.
- Spring: Almost half of all projects were first noticed in spring, coinciding with warming temperatures. Nearly two-thirds of projects were completed in this quarter, likely for the same reason; warm temperatures allowed them to carry over from winter. Likewise, this season accounted for one-third of projects completed in one quarter and nearly a quarter of ongoing projects.
- Summer: Unlike other regions, summer accounted for the only instance of a project showing no progress; this could be due to hot temperatures. Summer accounted for less than a quarter of projects first noticed, also likely due to hot temperatures. Conversely, half of projects completed in one quarter occurred in summertime, likely due to the warmer temperatures.
- Autumn: Over a fifth of ongoing projects occurred in autumn, along with the same percentages of project completion and projects first noticed as winter, likely due to the similar weather conditions between the two seasons.
Overall, the number of ongoing projects in each quarter remained relatively consistent, likely due to the warmer temperatures in the south, allowing for continued progress through autumn and winter.
Central conditions: Warmer summers than average, along with spring and autumn. Winter is moderately cold. Precipitation remains relatively steady throughout the year, increasing in spring and summer, then decreasing from autumn into winter.
- Winter: This quarter consisted entirely of ongoing projects, likely because of cold temperatures halting other project phases until after winter.
- Spring: Nearly two-thirds of projects were first noticed in this quarter, most likely due to warming temperatures following wintertime. The same can be inferred for project completion, where spring encompassed over half of these, as well as over half of project completion within one quarter. Spring encompasses over a third of projects with no progress, likely as a holdover from winter.
- Summer: This quarter accounted for almost half of all projects showing no progress; increased rainfall might affect this statistic. However, summer also accounted for over a third of ongoing projects and project completion, as well as 30 percent of projects first being noticed. It also accounted for nearly half of projects completed in one quarter; like spring, warm weather allows for quicker progress.
- Autumn: This season mostly consisted of ongoing projects, likely carrying over from summer and including those that continue into winter. The number of projects with no progress in this quarter may be due to halts carrying over from summer, or because of increased precipitation after a drier summer. These conditions could also affect the small percentages of project completion and projects first noticed in this season.
Trend Two: Geographic Distribution of Projects
This project assessed demographic data for variances between military districts that would impact project status and/or airliner activity. Analysts found that while population and density scaled with the designed capabilities of the airport as well as the concentration of higher capability airports, the projects were tailored to the needs of specific airports. Therefore, region-based trend analysis using demographics would require data outside the scope of this product.
This project assessed geographic proximity to Ukraine for trend variations between regions after the February 24th, 2022, upscaling in the Russo-Ukraine conflict. Analysts found that airports in immediate proximity to Russia are at potential risk for direct impact, such as Princess Olga International Airport (Western Military District), which is a mixed military and commercial location, and was the target of Ukrainian drone attacks on September 29th, 2023. There are additional reports of attacks targeting other airports and manufacturing plants in relative proximity that have been either successful or intercepted. However, the Ukrainian military has increased its long-range strike capability into Russia as the war has progressed, suggesting that RCAI locations that share space with military assets are at higher risk than those within closest proximity.
Airport flight frequency by military district and airport size
Overall, the Eastern district led the whole of Russia in construction projects across all types. The authors view is this is likely due to its distance from the effects of the war. Its rurality also aids in having more room to expand. Within this district, the plurality of projects was miscellaneous, but not by much more than runway or building projects. However, this does not mean that these miscellaneous projects were necessarily expensive or major. The close ratio between steady and inconsistent airport activity levels could mean that current air traffic levels do not necessitate larger projects in general, and the authors determine this is likely on a location-by-location basis.
The Central district had the second highest average percentages of projects across all types; like the Eastern district, it is the authors' view its physical distance from the effects of the war may aid in this. Within the region, most projects were miscellaneous, followed by building and runway projects, respectively. As with the Eastern region, the close ratio between steady and inconsistent airport activity levels may explain that across the region, airports do not have enough activity to warrant larger projects with buildings and runways.
Following this was the Western district, which accounted for the second-highest number of miscellaneous projects. With this, over half of the projects in the region were miscellaneous, followed by building and runway projects. This may be explained by the higher population density in the region relative to other regions, making for higher air traffic that limits the amount of building and runway projects possible during commercial activities. Conversely, it could also be due to the close ratio between steady and inconsistent airport activity levels, as the latter account for less major projects because they do not warrant them, as per the analysts' view.
The Southern district had the second-to-last average percentage of projects, despite its high population density; this is likely because of the Russo-Ukrainian war, as the district borders Ukraine. Building projects were the majority of projects in this district; as most airports in the region are at steady activity levels, the analysts feel this may be due to construction focusing on buildings as other projects are completed.
Finally, the OSK North Fleet district made up the least number of total projects. This is primarily due to the low number of airports in the region, thus reducing the number of projects possible. Within the district, miscellaneous and runway projects were roughly equivalent, but building projects made up only 14.29 percent of total projects. The authors believe this is likely due to miscellaneous and runway infrastructure requiring more work due to higher precipitation and sub-freezing temperatures.
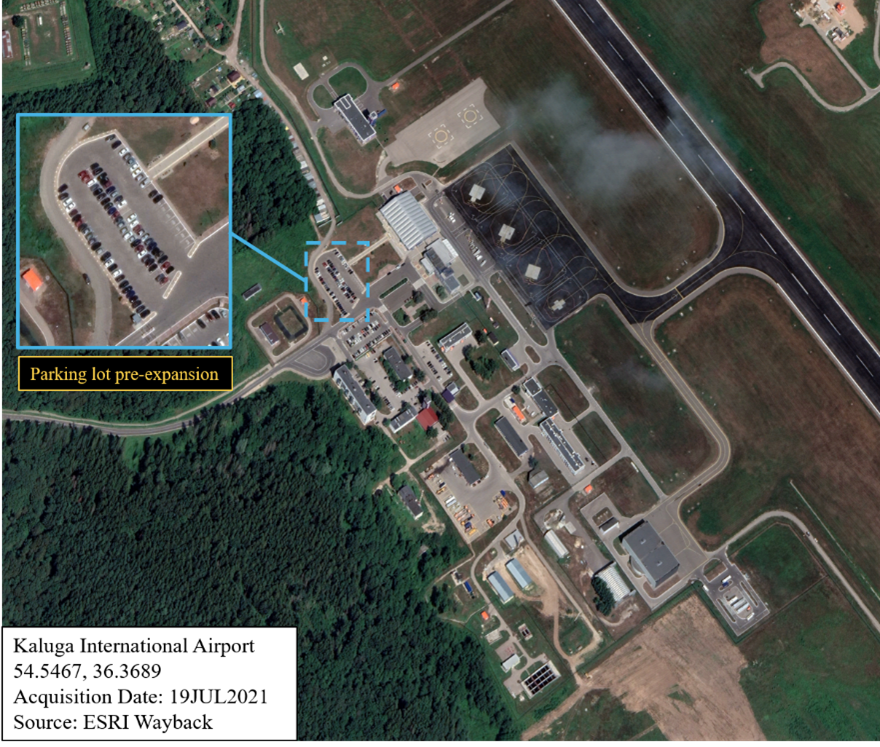
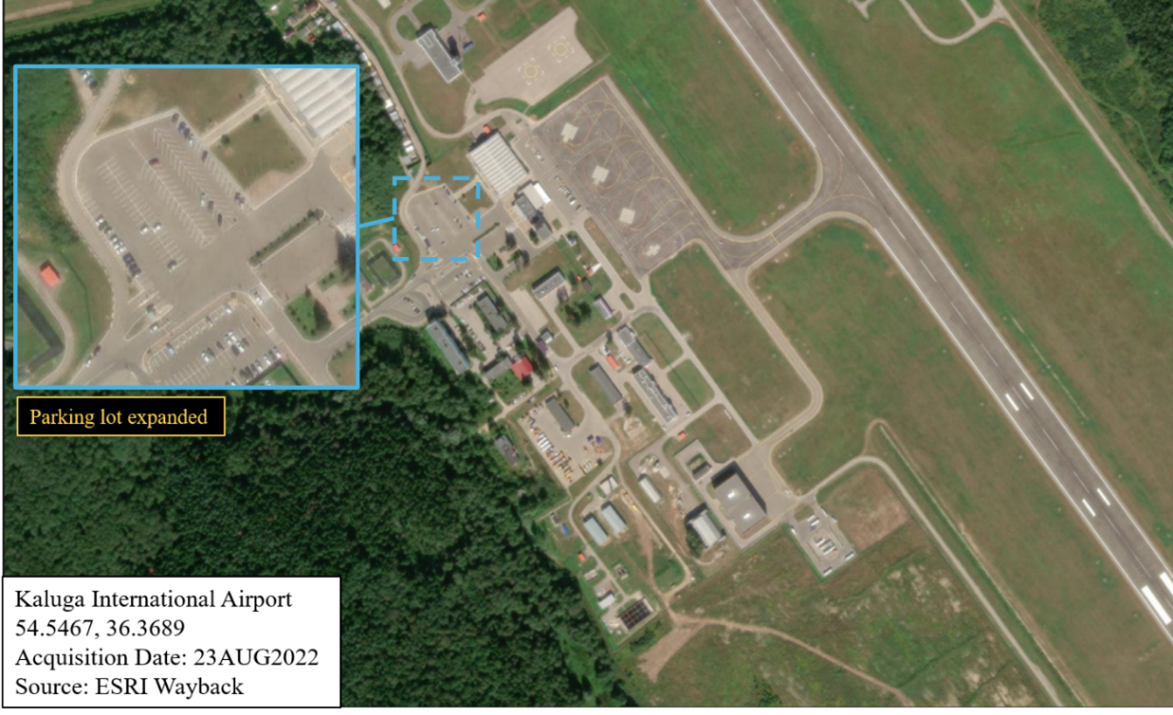
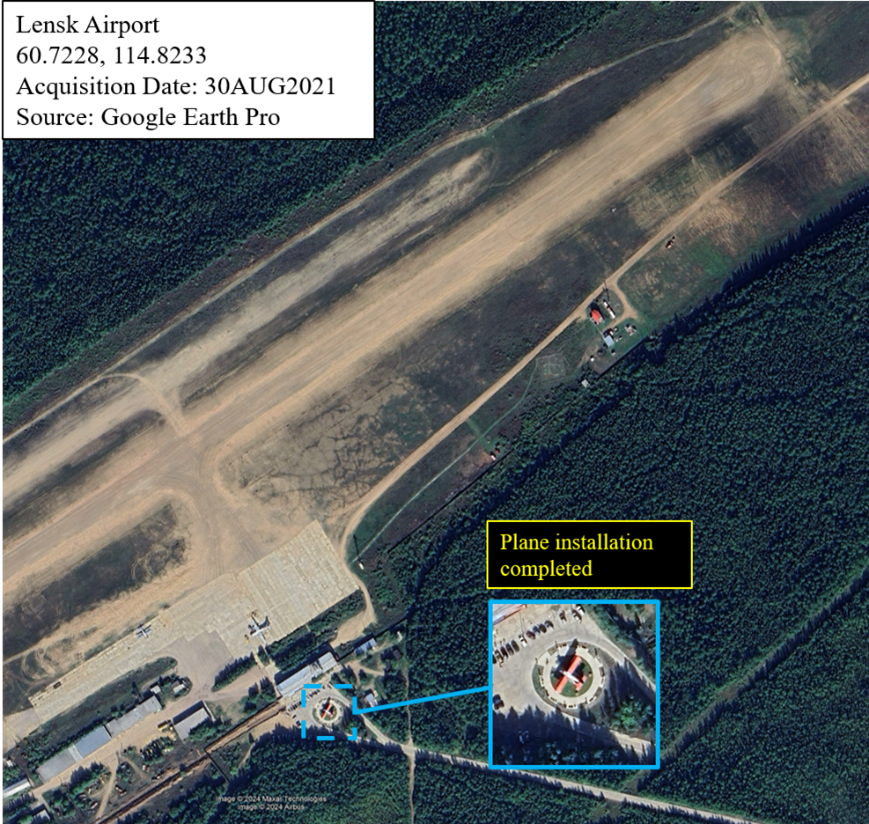
Examples of each type of projects encountered follows:
- Infrastructure (signal equipment, roads, parking lots)
- Non-runway tarmac (including repaving)
- Storage facilities (materials and aircraft)
- Aesthetics (monuments, parks)
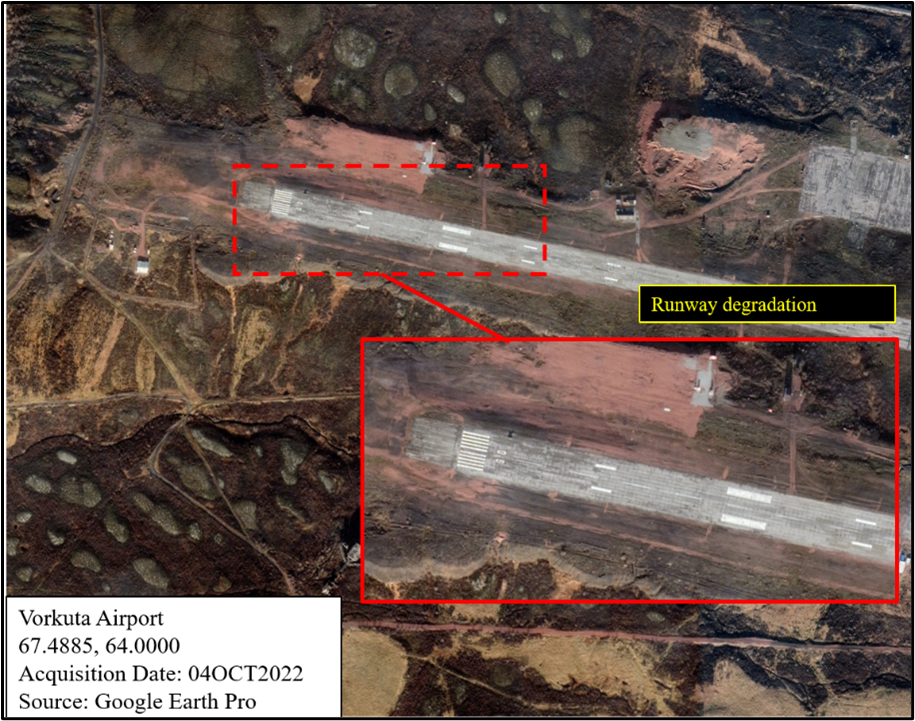
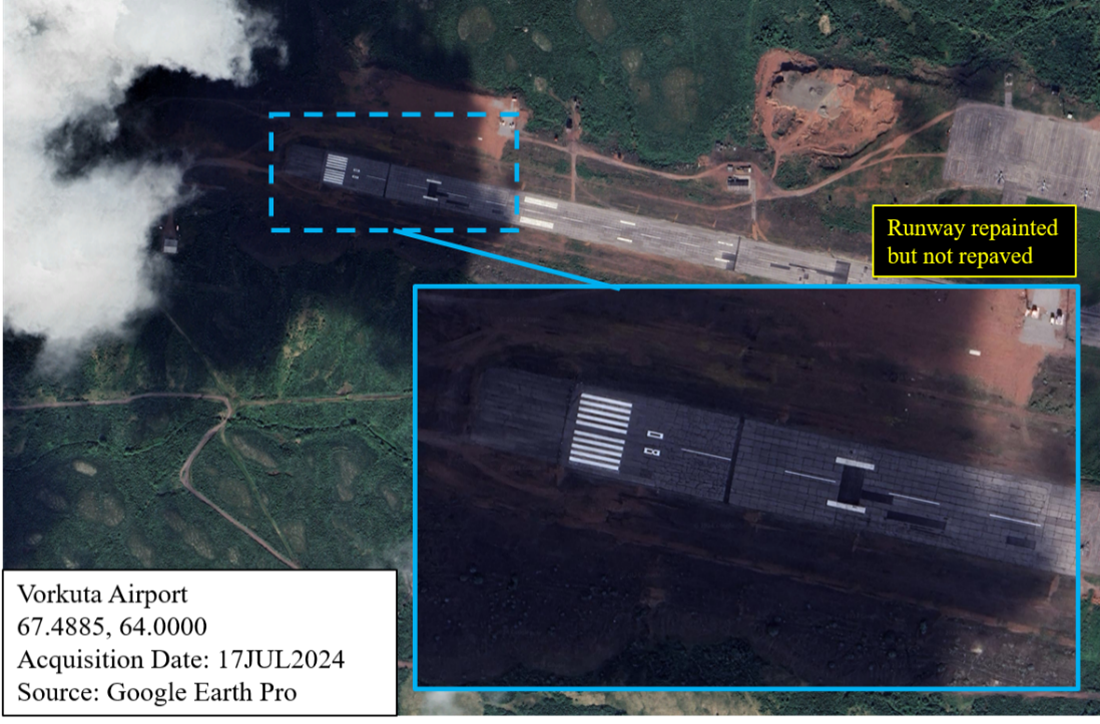
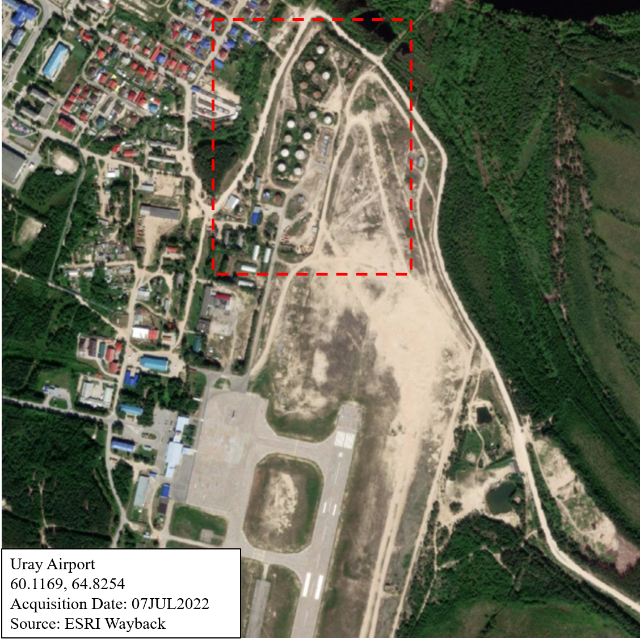
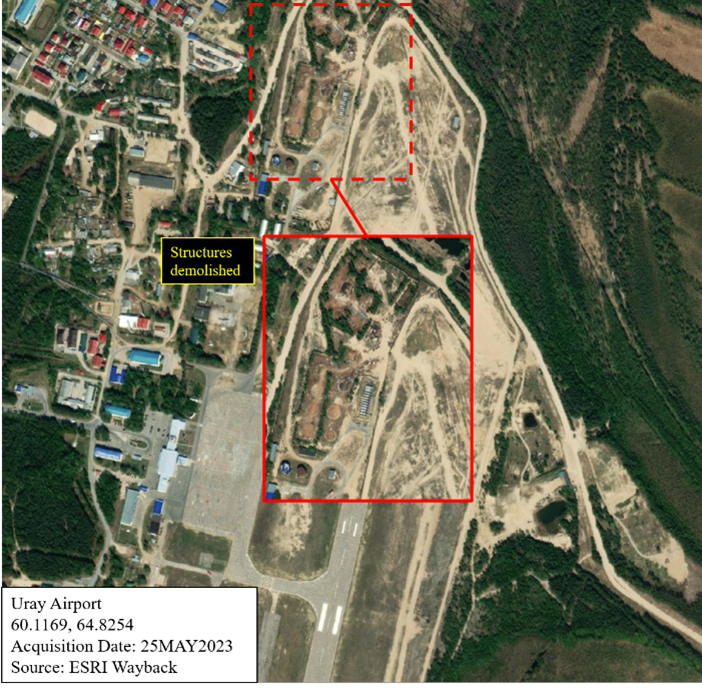
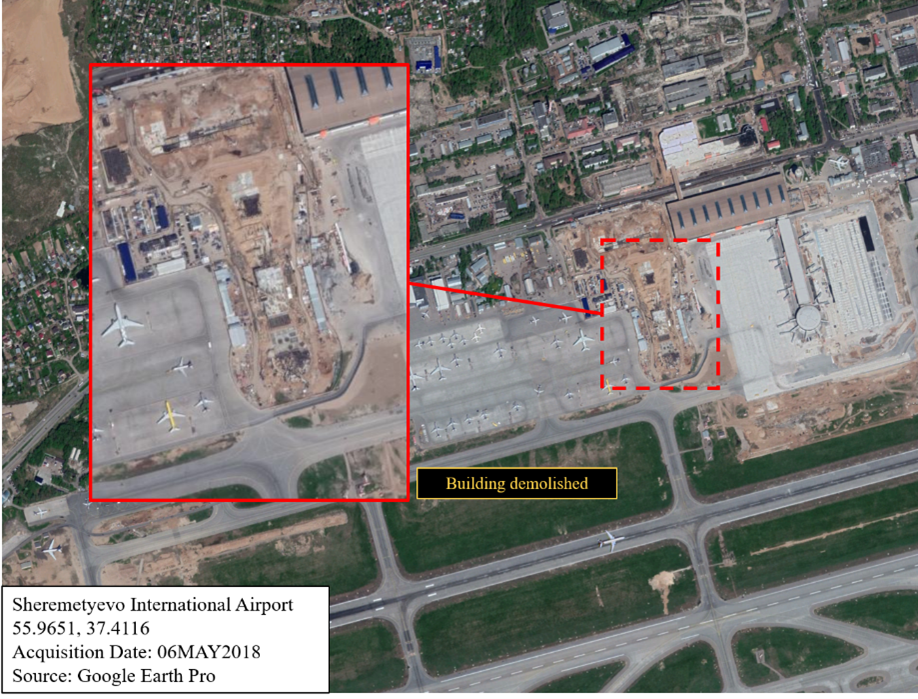
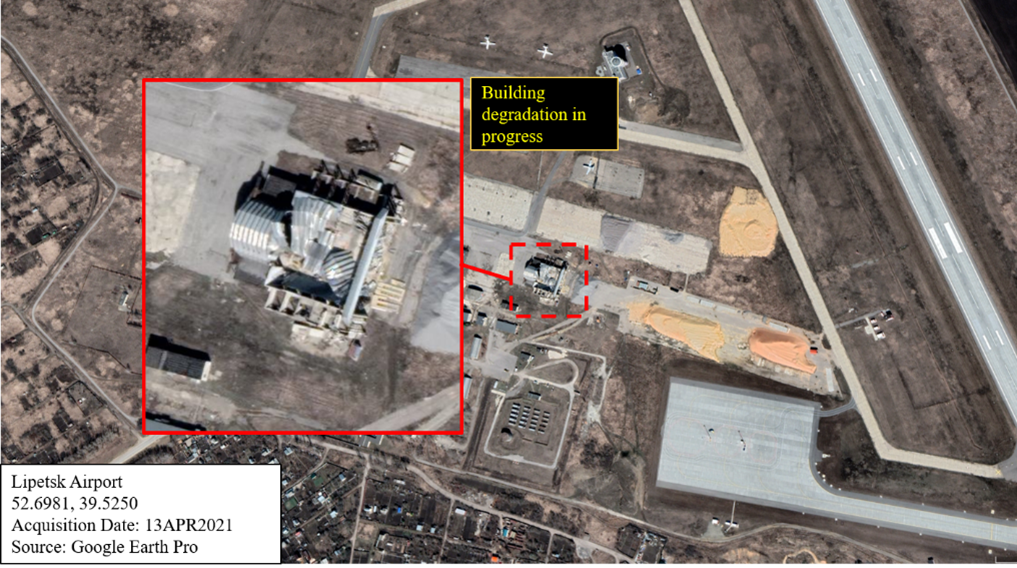
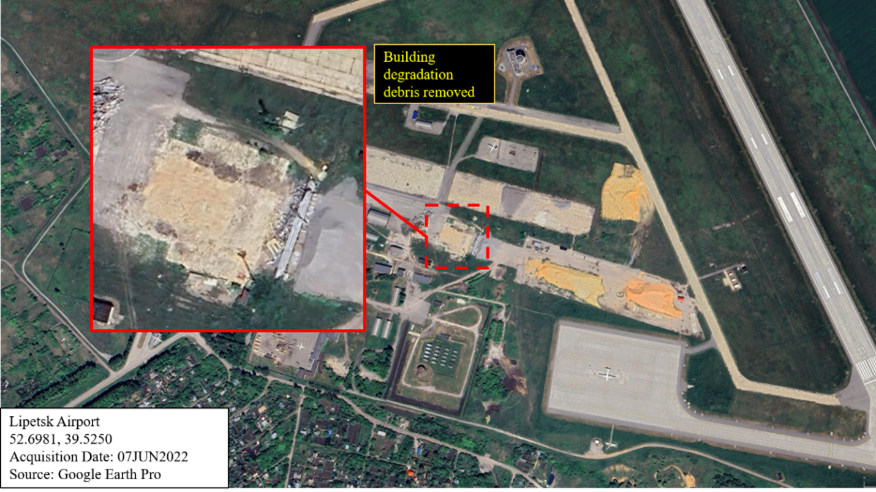
Trend Three: Degradation and Demolition
Degradation refers to biogenic and anthropogenic decline in infrastructure quality over time. For example, this includes runway deterioration over time due to aircraft usage.
Demolition is defined as the purposeful destruction of buildings and other infrastructure. For simplicity, the terms demolition and deconstruction are used interchangeably.
Across all of Russia, analysts found 70 indicators of demolition or degradation. The majority of these happened in the Central district, likely because the upkeep of a large number of airports inherently includes cycles of construction and demolition. Furthermore, most degradation occurred in 2020 and 2021, likely a result of the COVID-19 pandemic slowing or halting airport activity, including construction projects. OSK North Fleet saw the least degradation or demolition, with only one indicator for the whole region during the period. However, the authors feel this was likely due to the small number of airports seeing less traffic compared to other regions, and therefore experiencing less wear on infrastructure.
Initially, analysts marked certain indicators of runway degradation, such as grass growing on the runway (known as foreign object debris, or FOD). However, many locations had grass or other foliage on the runway but still had flight activity, and degradation was never resolved between the first appearance of FOD and the last collected image. This suggests that this FOD is a non-factor for airport operations and may be a way for the RCAI to save money for other projects.
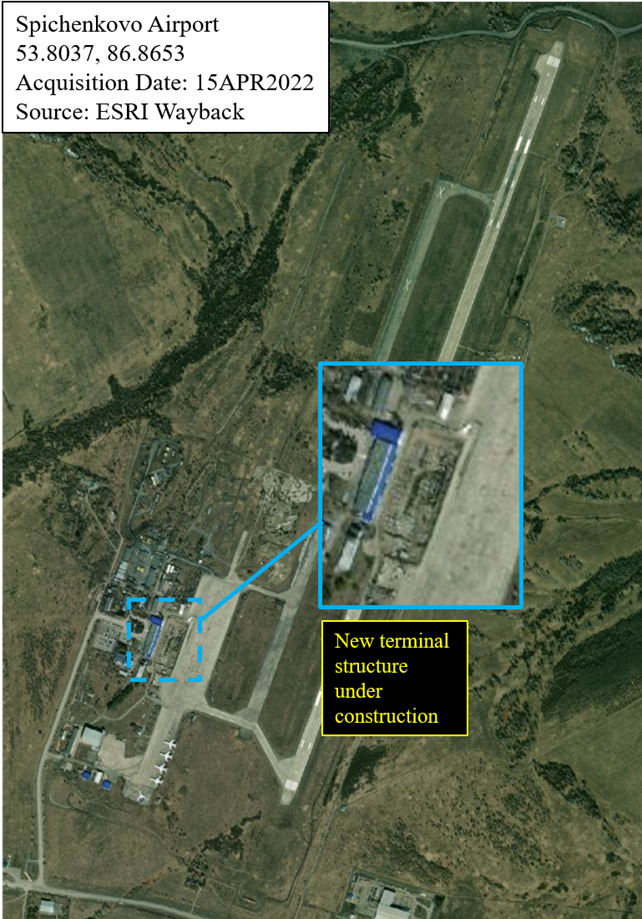
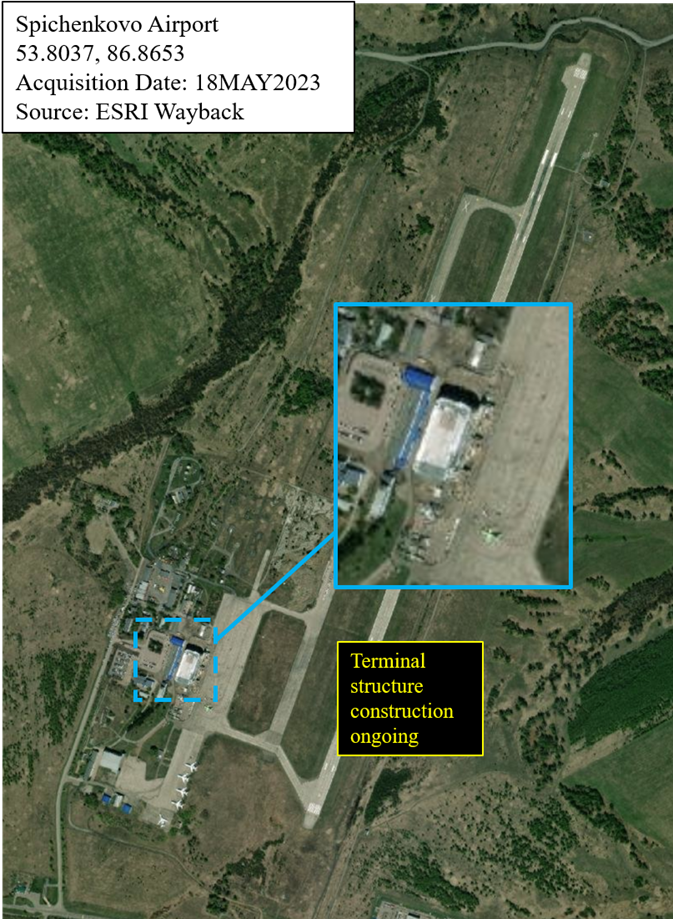
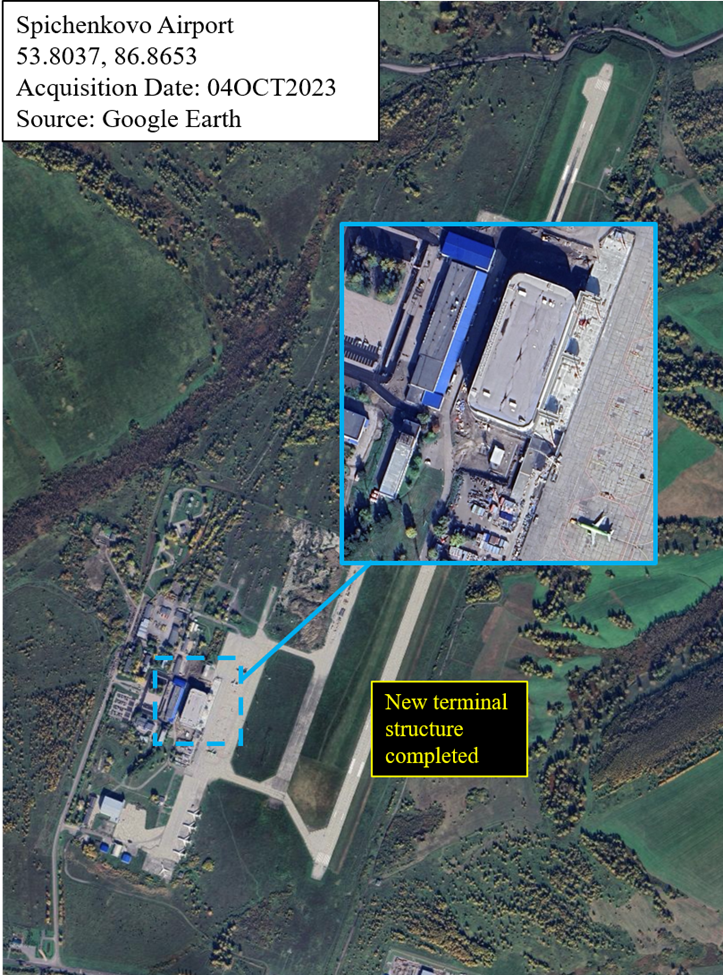
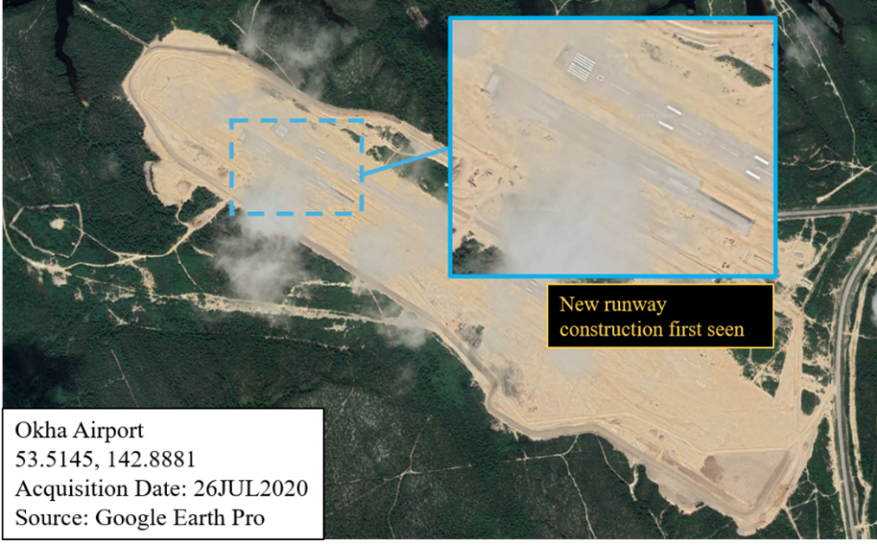
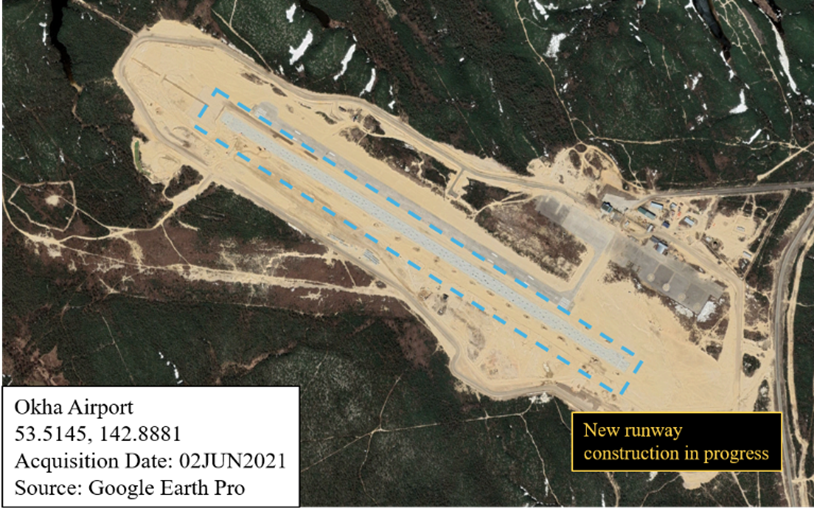
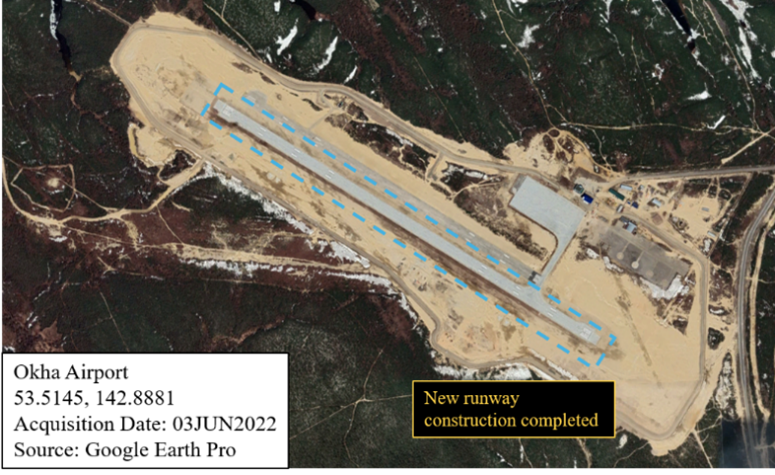
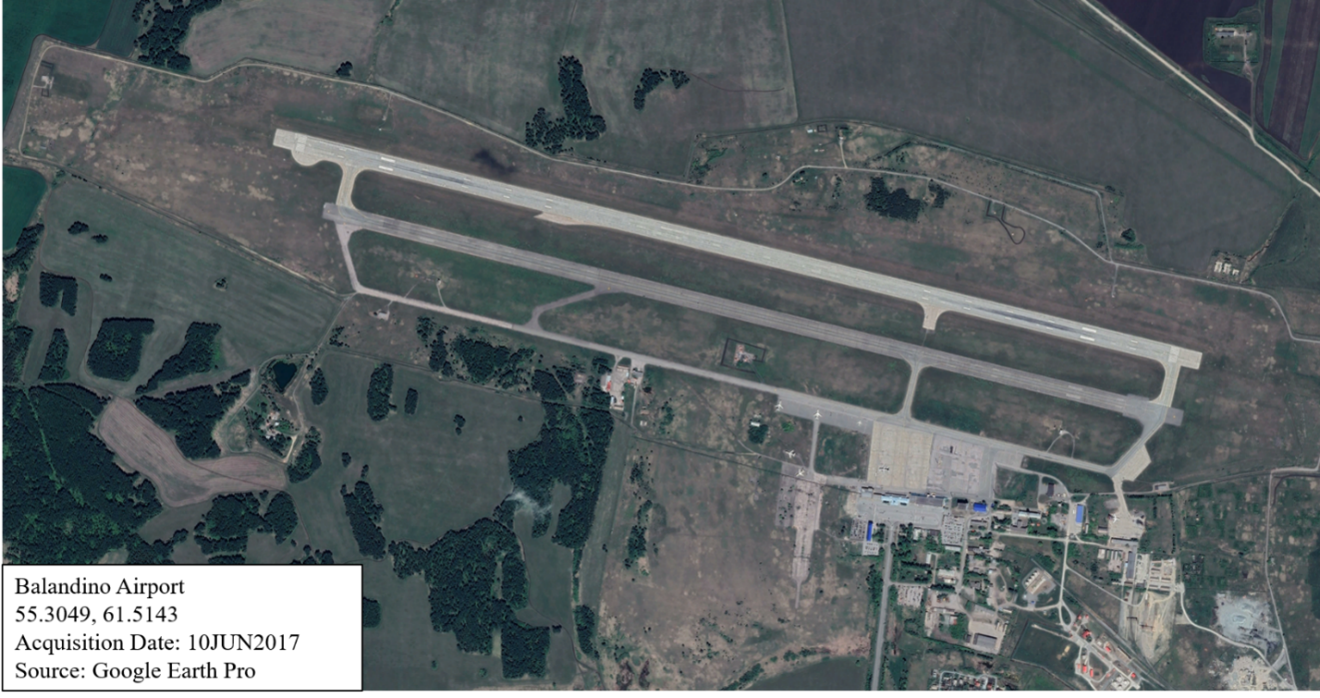
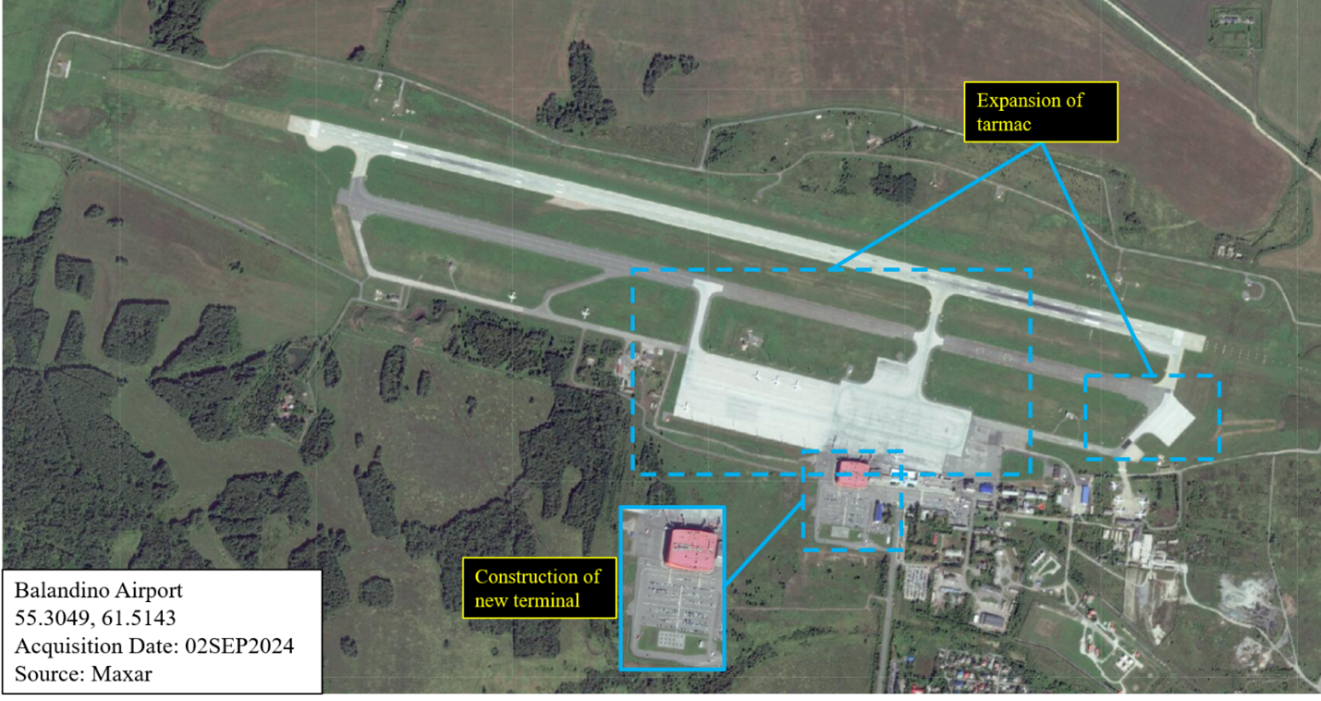
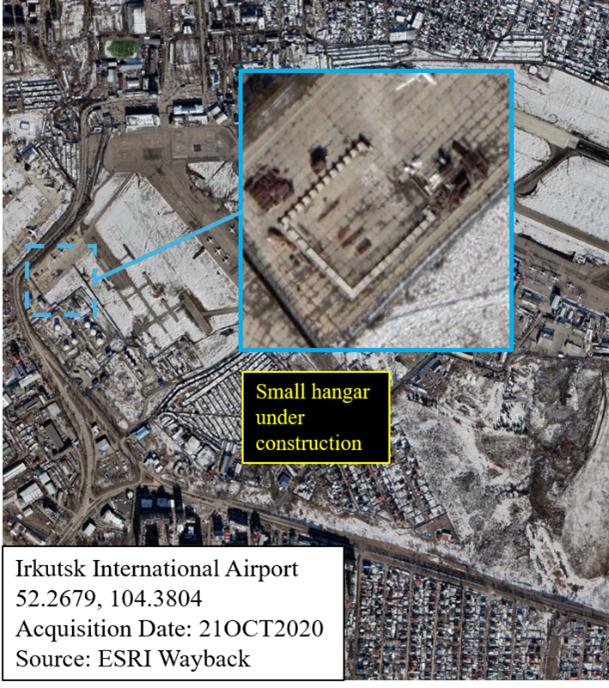
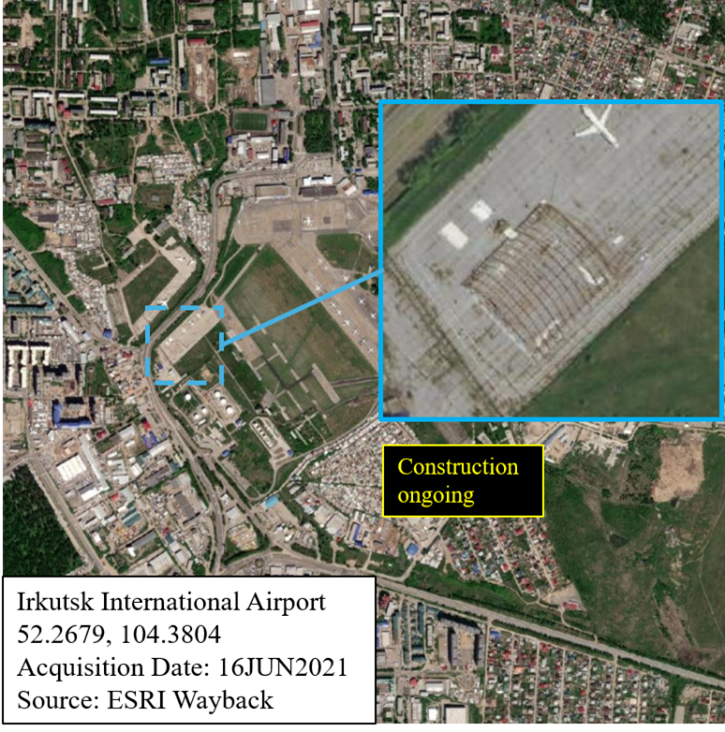
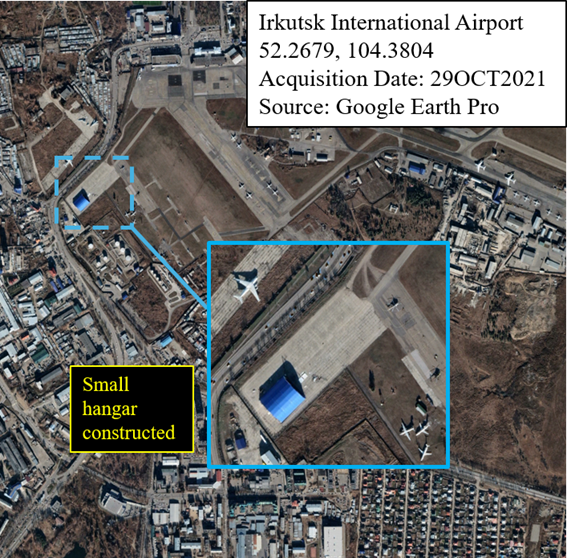
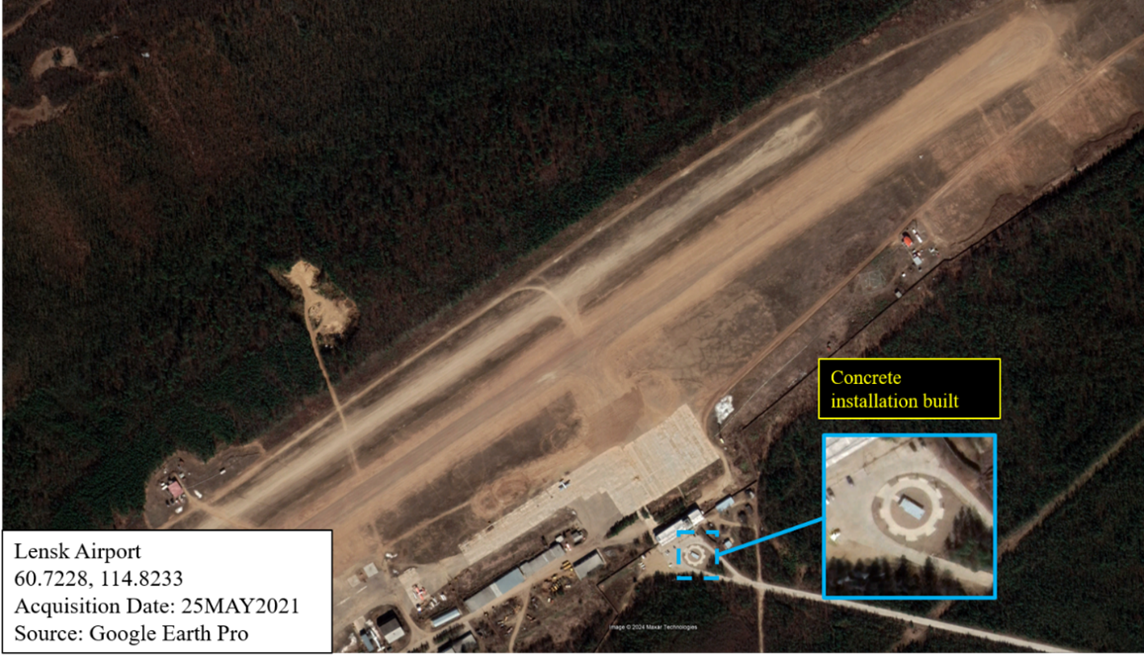
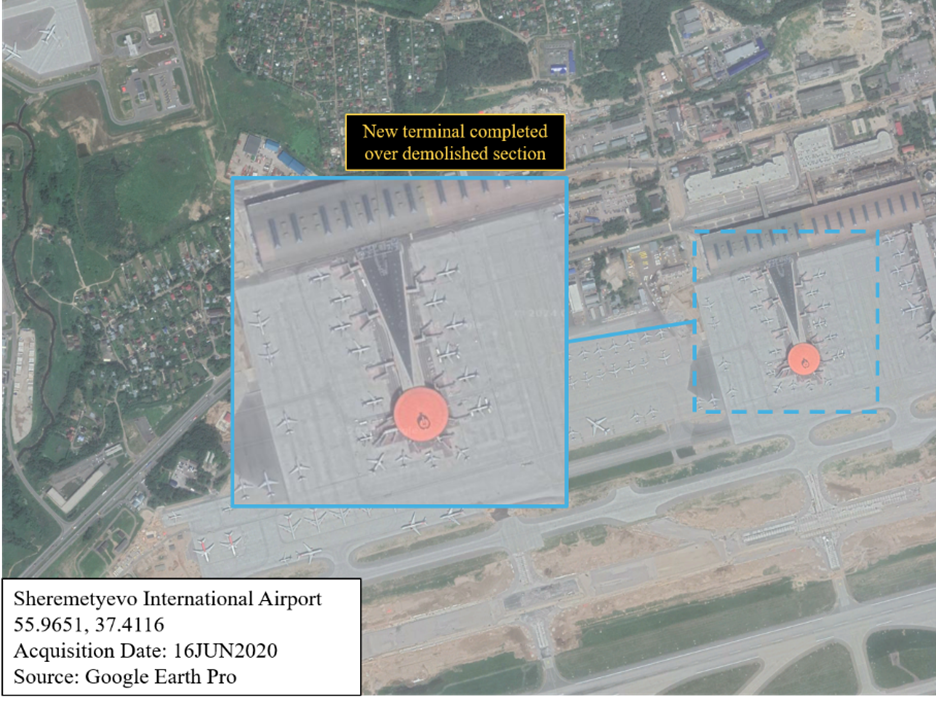
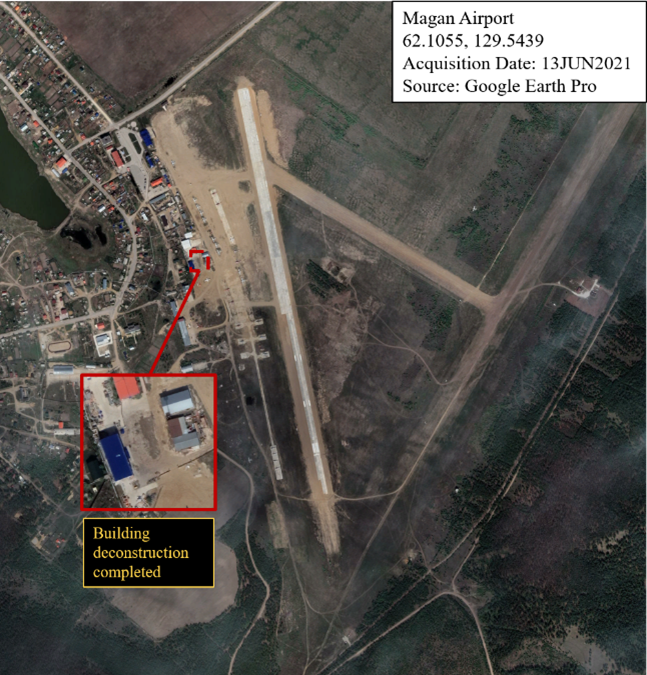
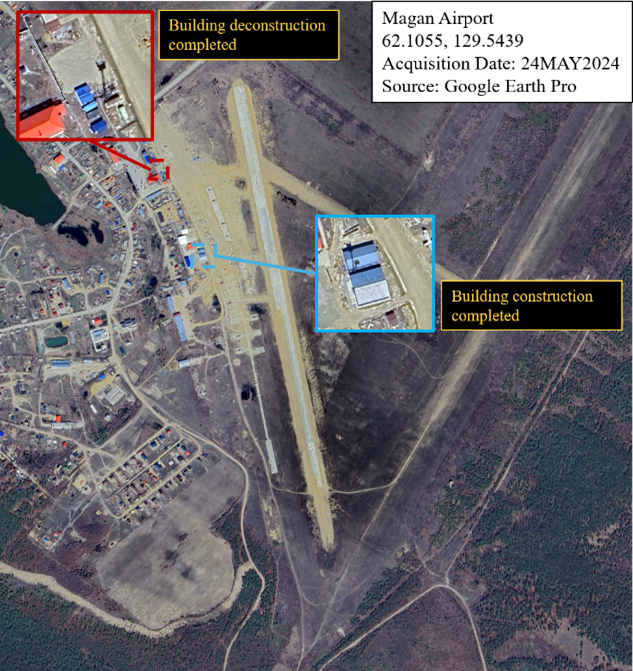
In some cases, demolition followed by construction on the same location, replacing the previous structure. Select examples are represented below.

Analytic Confidence:
The analytic confidence was moderate. Structured analytic techniques were used internally to vet assessments. Overall source reliability was moderate to high, with very little conflict amongst sources. Analysts had a moderate level of expertise with the topic and collaborated in a team environment. The task was moderately complex and challenging, with a moderate deadline.
References
- https://www.wilsoncenter.org/blog-post/russias-civil-aviation-wake-sanctions
- https://www.reuters.com/business/aerospace-defense/russias-plane-shortage-holds-air-travel-back-wartime-wages-drive-demand-2024-11-28/
- https://www.wilsoncenter.org/blog-post/russias-civil-aviation-wake-sanctions
- https://www.bbc.com/news/world-europe-60539303
- https://www.euronews.com/travel/2024/07/30/heres-how-restrictions-on-flying-over-russia-are-making-flights-longer-and-more-expensive
- https://www.wilsoncenter.org/blog-post/russias-civil-aviation-wake-sanctions
- https://aviationweek.com/air-transport/maintenance-training/russian-regulator-approves-aircraft-cannibalization-amid
- https://www.politico.eu/article/fake-parts-for-russias-stolen-airliners/
- https://www.businessinsider.com/sanction-hit-russia-airlines-getting-plane-parts-delivered-luggage-report-2024-5?op=1
- Ibid.
- https://www.kyivpost.com/post/32561
- https://www.reuters.com/world/europe/how-russia-keeps-its-fleet-western-jets-air-2023-08-23/
- https://www.kyivpost.com/post/32561
- https://www.reuters.com/world/europe/how-russia-keeps-its-fleet-western-jets-air-2023-08-23/
- https://www.favt.ru/dejatelnost-ajeroporty-i-ajerodromy-reestr-grajdanskih-ajerodromov-rf/
- https://www.fallingrain.com/world/RS/airports.htm
- https://rg.ru/2015/09/01/aviadvijenie-site-dok.html
- https://pmc.ncbi.nlm.nih.gov/articles/PMC8365565/
- https://www.worlddata.info/europe/russia/climate-central-russia.php
- https://www.weather.gov/arx/why_snowratios
Look Ahead
The data collection timeframe included an ongoing year (2024) at the time of analysis. As such, data for 2024is incomplete; sources have not entered the most recent imagery yet. Furthermore, analysts did not collect images from before Q1 2017, so if a project was in progress or just completed before this period, then it was not reflected in the data and outside the scope of this project. Concurrently, in Q1 2017, almost all locations did not have imagery (96.7 percent). For future research to avoid imagery gaps, analysts should adjust the timeframe's start date to account for earlier data for a holistic trend analysis and adjust the end date to not include a timeframe concurrent with the collection phase. Due to time constraints, analysts did not collect imagery and open-source information on manufacturing plants and scrapyards, two metrics that were identified as key components of the RCAI. Future research should include these locations to enhance the report's accuracy and provide a comprehensive assessment of the RCAI. These sites are integral to understanding Russia's sanction circumvention strategies, such as domestic parts sourcing and parts cannibalization. Financial data on airlines, manufacturers, and airports would help fill information gaps, as still imagery does not provide complete information on project statuses. White papers on financial distribution and policy changes from the Federal Air Transport Agency would provide insight on the funding and monitoring of state-funded projects. Analysts encountered limited supply chain information on aircraft parts imported by Russia; part lists for commercial airframes are open-source information available for further research.
Things to Watch
- Will Russian aerospace and defense companies meet their goals for in-house production of previously imported parts?
- Will non-sanctioning countries be sufficient resources for Russia to sustain its foreign-manufactured fleet of commercial airliners in the short term?
- Are Russian airline fleets increasing or decreasing? Is the number of domestically manufactured aircraft increasing?
- Are countries that previously barred Russian international flights reopening business?
Data Sources
About The Authors
Mercyhurst Graduate Student
Mercyhurst Graduate Student
Mercyhurst Student Contributor
Mercyhurst Student Contributor
Mercyhurst Student Contributor
Mercyhurst Student Contributor
Mercyhurst Student Contributor
Mercyhurst Student Contributor
Mercyhurst Student Contributor
Mercyhurst Student Contributor
Mercyhurst Student Contributor
Mercyhurst Student Contributor

Methodologies Reviewed by NGA
Publication of this article does not constitute an endorsement of the contents, conclusions, or opinions of the author(s). The published article’s contents, conclusions, and opinions are solely that of the author(s) and are in no way attributable or an endorsement by the National Geospatial-Intelligence Agency, the Department of Defense, the United States Intelligence Community, or the United States Government. For additional information, please see the Tearline Comprehensive Disclaimer at https://www.tearline.mil/disclaimers.