Overview
Open GEOINT shows that the number of smaller-than-city-bus passenger vehicles (SPVs) on the streets of Hamhung, North Korea has increased modestly over the past 15 years and has been accompanied by modest improvements in vehicle infrastructure in the city. Our analysis also makes possible an estimate of vehicles per capita in Hamhung and possibly North Korea.
Activity
Our analysis has led to three key findings: (1) the number of SPVs in Hamhung appears to be increasing slightly but steadily, (2) this increase has been accompanied by modest infrastructure upgrades in the city, and (3) the widely cited figure of 30,000 total vehicles for all of North Korea is probably an underestimate. Our data, extrapolated with caveats, would suggest the presence of between 20,400 and 34,000 SPVs alone in North Korea.
Background
Under Kim Jong-un, North Korea’s political leadership has pledged to place more emphasis on the development of its civilian economy. Known as byungjin (dual development [of the economy and military]) this policy was seen as a subtle shift away from the sungun (military first) policy of Kim’s father, Kim Jong-il.
Kim Jong-un has frequently demonstrated his commitment to byungjin by visiting non-military production facilities, promoting new development projects, and creating a “short course” for local officials on how to “struggle for local development.”
Whether byungjin has brought meaningful development to North Korea is an open question. The paucity of data makes traditional means of analysis difficult. For decades researchers on the North Korean economy have turned to defector interviews and “mirror statistics” as a means of obtaining proxy economic data.Nicholas Eberstadt, “North Korea’s Interlocked Economic Crises: Some Indications from ‘Mirror Statistics,’” Asian Survey 38, no. 3 (1998): 203–30, https://doi.org/10.2307/2645426, Accessed June 5, 2024; Mark E. Manyin, “North Korea: September 2022 Update” (Congressional Research Service, September 15, 2022), https://crsreports.congress.gov/product/pdf/R/R47242/3, Accessed June 5, 2024.[1] More recently researchers have explored remote sensing data as a means of research.Krishna B. Kumar, Troy D. Smith, Diana Y. Myers, Timothy R. Gulden, and Noah Johnson, From Hermit Kingdom to Open for Business: Developing a Blueprint for North Korea’s Economic Development, (Santa Monica, California: RAND Corporation, May 25, 2021), 19-23, https://doi.org/10.7249/RR-A1128-1, Accessed June 5, 2024.[2]
Using satellite imagery, open data, and a defector interview, our team has surveyed SPVs numbers in the city of Hamhung since 2007. We assume a weak correlation between the number of SPVs on the road and economic activity in Hamhung. Furthermore, our research proposes an SPVs per capita figure for Hamhung and possibly all of North Korea based on survey data.
Methods
Selection of Hamhung
Our team selected Hamhung for two main reasons.
First, Hamhung was both large enough to contain a significant number of vehicles and yet small enough to make manual counting possible within our manpower resources. Historically, Hamhung has been the second largest city in North Korea, but current UN estimates suggest it is now the third largest city behind Pyongyang and Chongjin, with an estimated population of 544,000.United Nations, Department of Economic and Social Affairs, Population Division, World Urbanization Prospects: The 2018 Revision, 2018, https://population.un.org/wup/Download/Files/WUP2018-F22-Cities_Over_300K_Annual.xls, Accessed June 5, 2024[3]
Second, since Hamhung is neither the capital city (Pyongyang) nor located close to the Chinese border (like Chongjin), we believed that vehicle numbers in Hamhung might more accurately reflect urban North Korean cities as a whole, rather than being artificially inflated by a concentration of political elites or those involved in cross-border international trade.
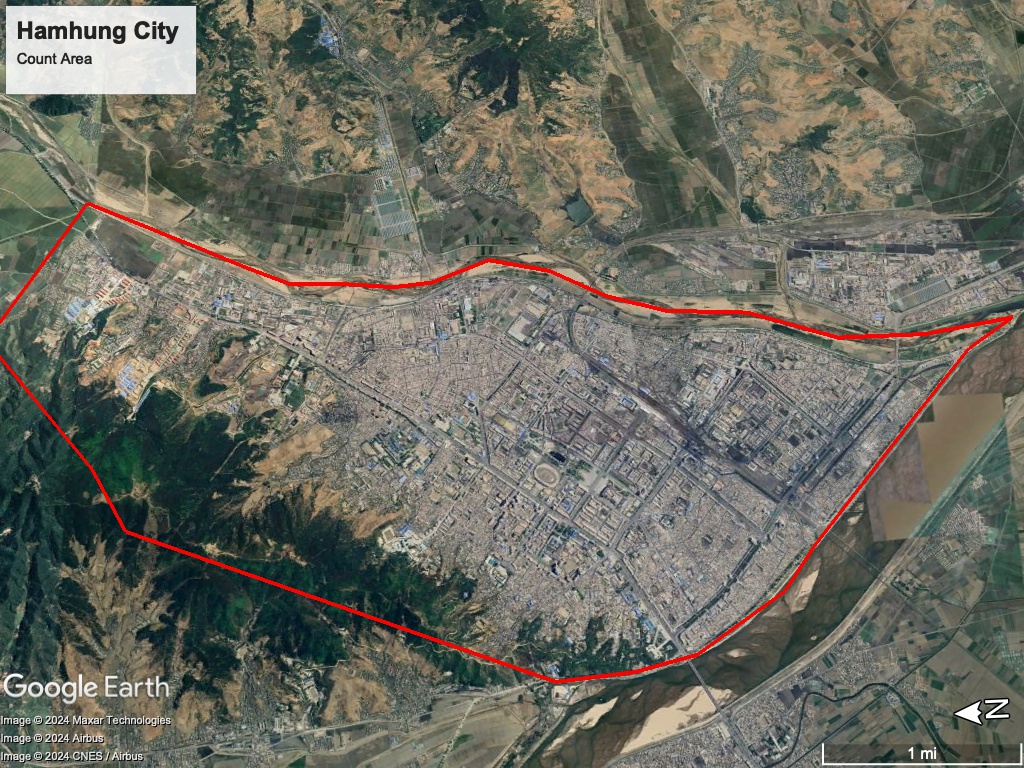
Within the administrative area of Hamhung (see image below) we further narrowed our survey area to the approximate boundaries of the historic city of Hamhung, specifically the heavily urbanized area east of the Seongcheon River, west of the Holyeon Stream, and south of Mt. Dongheung.Prior to 1977 this mountain was known as Mt. Ballyong (반룡산). See https://namu.wiki/w/%EB%8F%99%ED%9D%A5%EC%82%B0%EA%B5%AC%EC%97%AD[4] This area comprises approximately 22 km2. This area does not include the port of Hungnam, but our surveys of the port area indicated few SPVs in that area.
Counting Methods
Our team was divided into two groups: the manual count group and the Computer Vision (CV) group.
Manual Counting
The manual count group manually counted all visible SPVs in satellite imagery of Hamhung on nine selected survey days (Fig. 1) from 2007 to 2023. The selection of survey days was driven by the availability of suitable imagery, approximately 50 cm resolution, cloud-free, and cover the entire 22 km2 count area. Of the nine days selected, none were a Sunday and all the images were taken between 10:50 am and 11:59 am.These times are approximate and based on our own shadow analysis using the obelisk at 39°55'29.80'N 127°32'48.68'E.[5] Full coverage of central Hamhung proved to be considerably rare considering our standards, explaining our small sample size of nine suitable images. However, considering each counting day required counting and labeling hundreds of cars, these weather and resolution requirements were necessary for accuracy and confidence. Taking into account that our target was North Korea, we believe working off of this data was a foundational step on the issue.
In our sixteen-year date range from 2007 to 2023, there is a considerably large gap between counts from 2007 to 2015. In this eight-year gap, we chose to not count SPVs on many days due to cloud coverage and partial coverage of central Hamhung. Regarding cloud coverage, when clouds cover portions of the count area, we potentially lose out on tallying dozens or more SPVs. Resultantly, this could artificially lower our counts of SPVs, giving us a less precise idea of SPV growth or decline. Many of these days had full cloudless coverage of Hamhung, but they were made up of images taken from multiple satellite passes at different times of the day, making these days uncountable by our same-time standard. Having images at multiple time points introduces a variable that can affect the number of SPVs seen. For instance, a day with 9:00 am and 2:30 pm coverage may have differing densities of SPVs due to the time of day's influence on traffic. Nevertheless, our equations and calculations do take into account this time gap, and the graphical display of our data is to scale.
The difficulty of manual counting varied greatly based on the resolution of the imagery, the light, the presence of shadows, etc. In ideal conditions, distinguishing between an SPV and a small truck, such as a Hyundai Porter-style vehicle was easy. In less-than-ideal conditions, it required considerable judgment and interpretation. We generally considered vehicles SPVs if they were less than 20 ft in length and lacked a visible bed for cargo. Our team regularly checked questionable vehicles with other team members and undertook calibration activities to ensure that our counting procedures were uniform.
Originally, we hoped that our manual counting would merely serve to create a benchmark for the testing of our CV model (see below) however, it became clear that a scarcity of ultra high-resolution images (30cm for our CV model) for Hamhung necessitated that the bulk of our data for analysis be gathered from manual counts. Our team was capable of getting an accurate manual count from 40cm resolution, or even 50cm resolution in ideal conditions, whereas the CV struggled with imagery of lesser resolution than 30 cm.
One persistent challenge for our manual count team was the presence of vehicles in interior courtyards. Vehicles on roadways are easily visible at better resolutions. Vehicles in courtyards are much more difficult to distinguish. Since a major portion of the vehicles we counted were in such interior courtyards, we did not attempt manual counts with images of lesser resolution than 50cm.
CV Counting
Our team spent significant time training and evaluating a computer vision model to attempt to automate counting and increase speed and accuracy. As mentioned above, the results were promising on satellite imagery at or near a resolution of 30 cm per pixel. While a lack of high resolution imagery of our target meant the model would be unfeasible for a large-scale survey of Hamhung over the years, future analysis of higher value targets such as Pyongyang is likely.
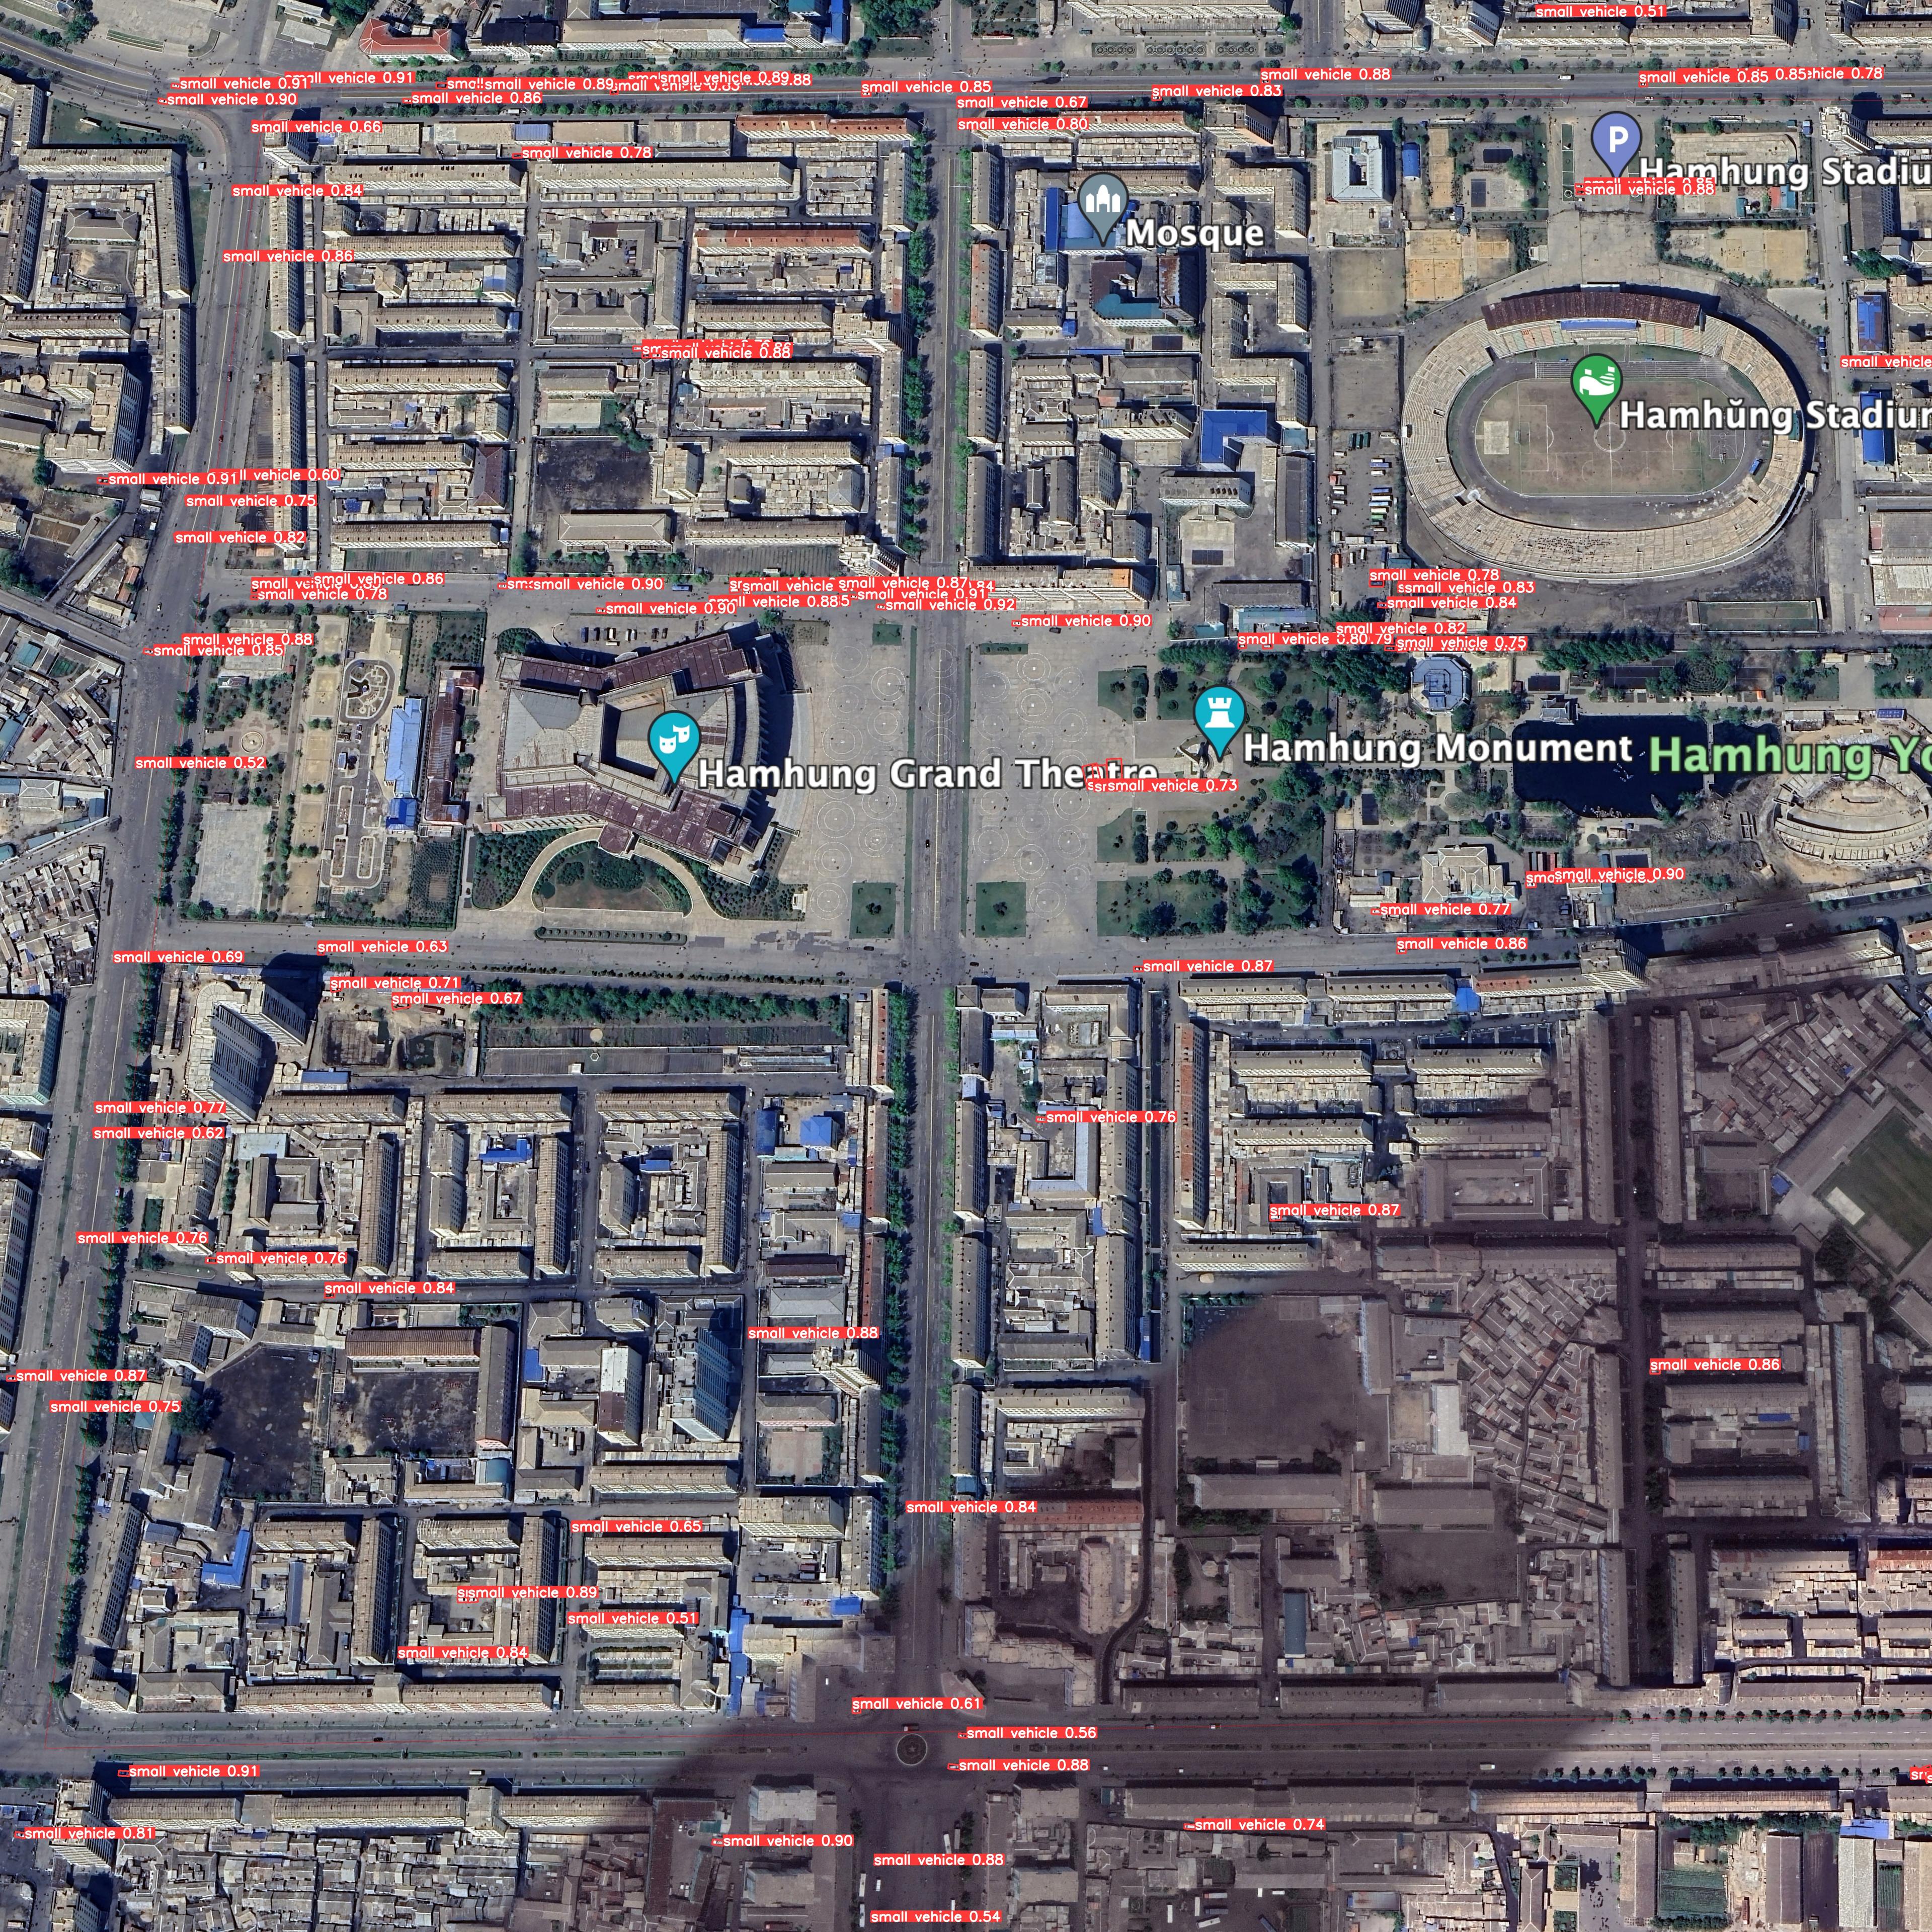
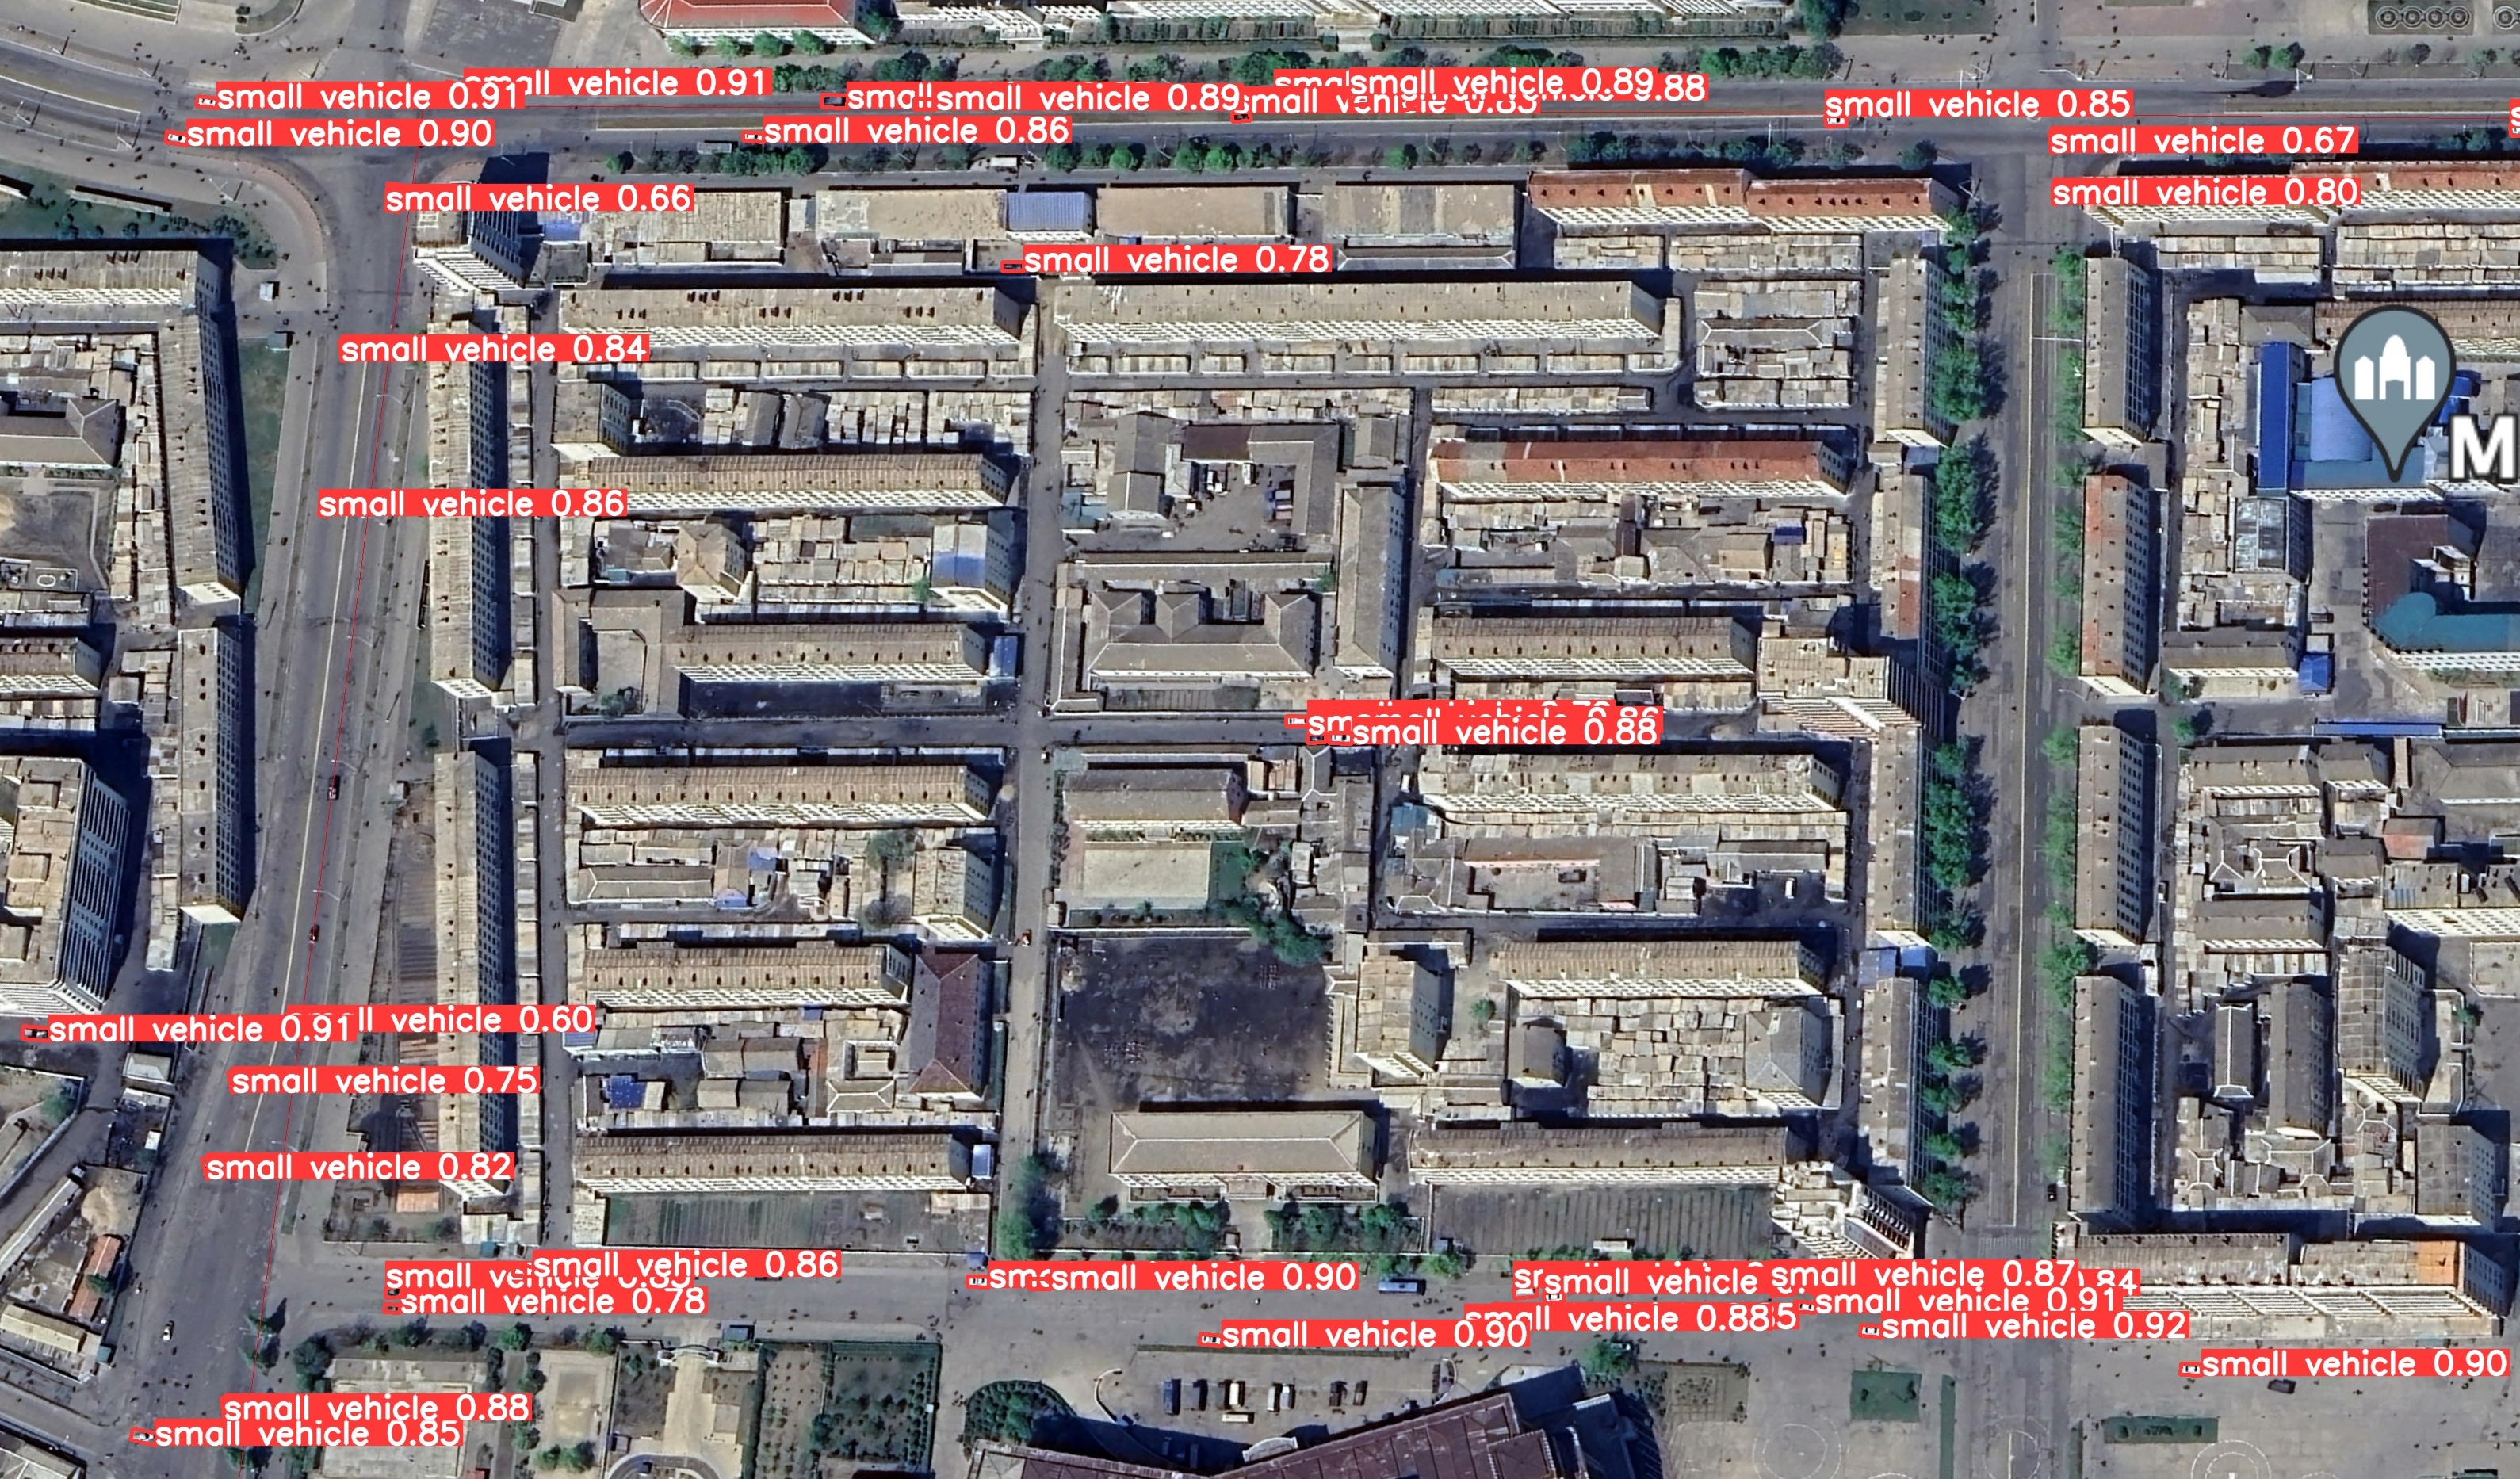
We trained Ultralytics’ open source “You Only Look Once” (YOLO) version 8 classifier model on a subset of the DOTAv2 dataset in order to detect cars from overhead imagery. (https://captain-whu.github.io/DOTA/index.html) To train the model we utilized the University of Wisconsin - Madison’s Center for High Throughput Computing. Accuracy of the model at this time is around 70% accuracy on target imagery of approximately 30 cm per pixel with few false positives. Accuracy here is defined as the percentage of cars the model successfully identifies out of the total number of cars in a given image. An example of the model classification is shown below. It is important to note our model specifically targeted small vehicles and did not attempt to identify trucks, buses, or other special vehicles.
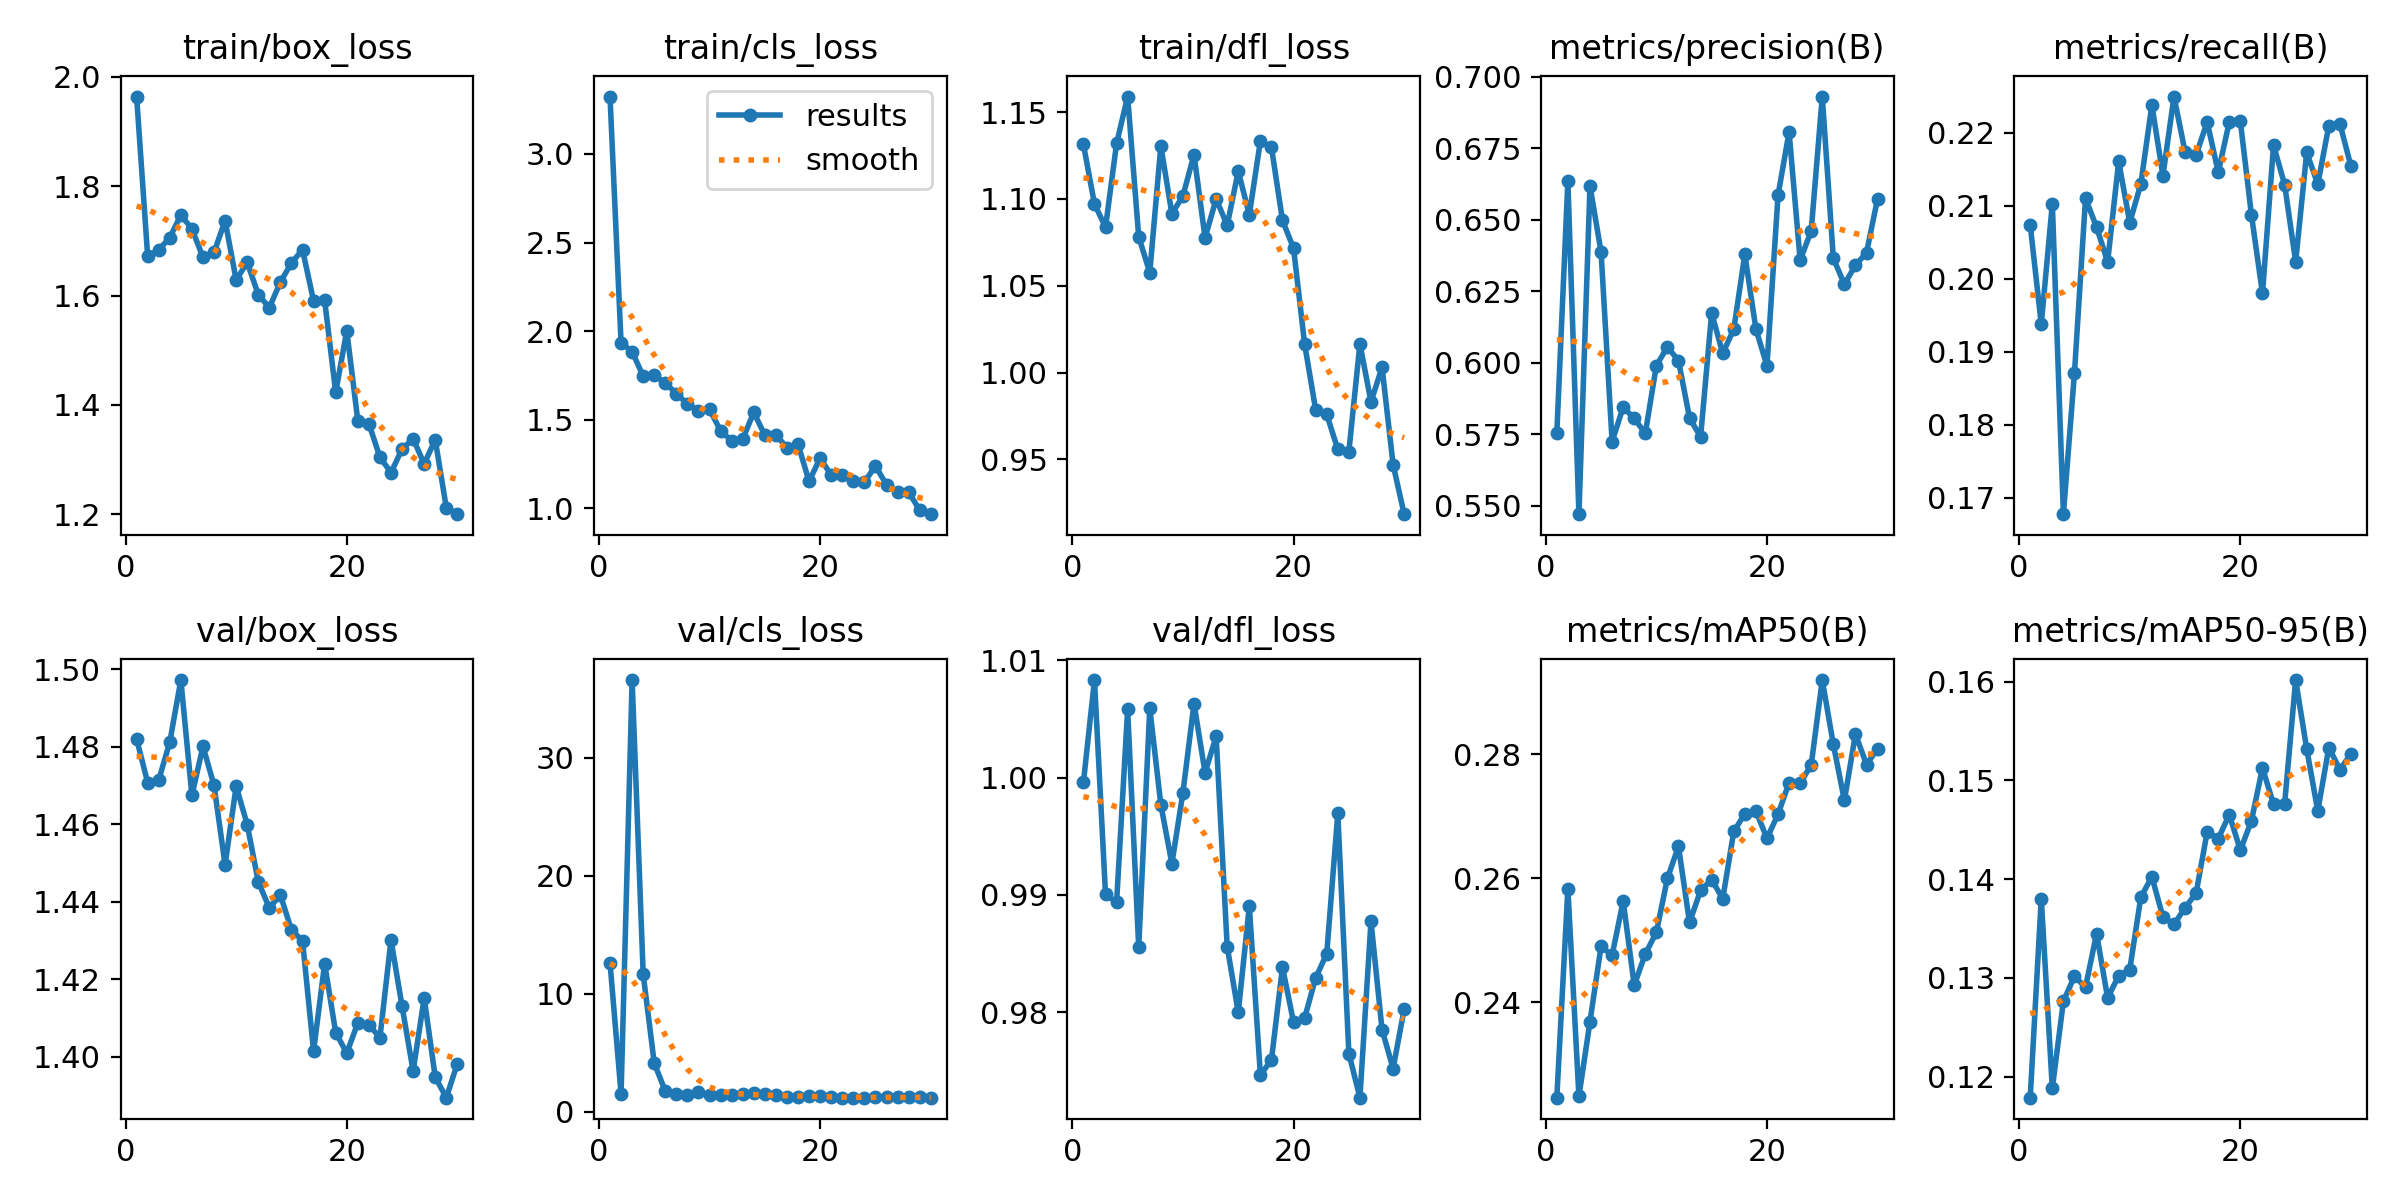
CV Training Metrics
We trained our model for 30 epochs over just one class from DOTA's dataset - the "small vehicle" class. DOTA provides tight bounding boxes for all object classification which allowed us to train the model on SPVs parked on angles that are not strictly orthogonal, something that all other datasets we surveyed could not provide. Below are various model metrics, including classification loss for both training and validation as well as precision and recall scores over the 30 training epochs:
We hope to further utilize and improve this model in the future to automate vehicle identification and counting on an even larger scale, as collecting such data on vehicle counts across time in locations such as Pyongyang could provide even more insight into North Korea’s economic situation.
Results
Number of SPVs in Hamhung is Increasing
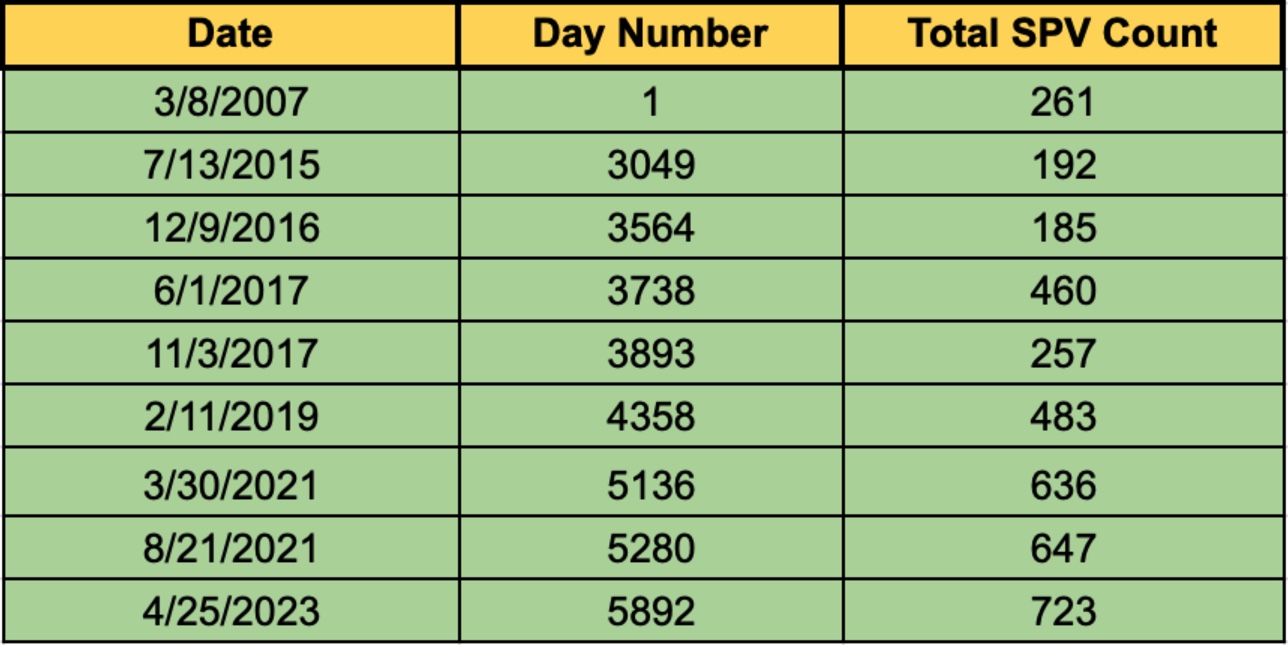
After finalizing and peer reviewing our survey days, we proceeded to record our results in a table to visualize any trends in the growth of total SPVs in Hamhung. Along with plotting the date, we decided to convert this to a total “Day Number.” This way, we could later determine the growth of SPVs per day as a metric for growth over time (see Fig. 1).
After organizing our Hamhung count data, we began linear regression and t-test analyses on the total SPV counts. Deciding our null hypothesis to be an absence of total automobile growth in Hamhung, we found a significant growth in the total number of SPVs over 16 years (see Fig. 2).
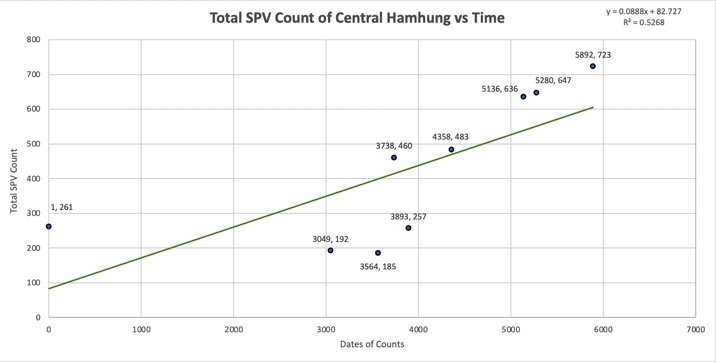
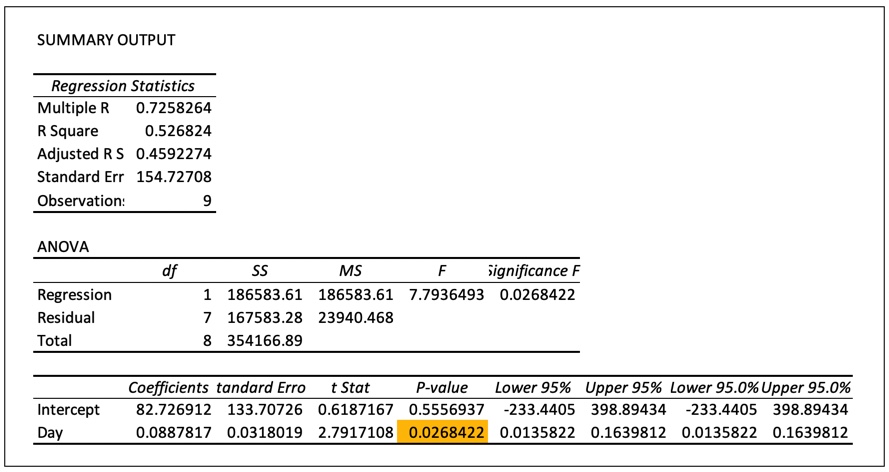
Our linear regression was performed using the Pearson correlation coefficient to generate an R value and a simple line of best-fit equation to visualize our correlation. We calculated the R value to be 0.725764883, and since R values range from +1 to -1, our 0.73 value indicates a strong association with our calculated equation y=0.0888x+82.727. This equation describes a growth rate of 0.0888 SPVs per day in Hamhung over these 16 years. To confirm our result further, we generated a p-value to determine whether we rejected or failed to reject our null hypothesis of a lack of growth in SPVs over time in Hamhung. By setting our acceptable threshold of a p-value of <0.05, we were stating we required greater than 95% confidence to reject our null hypothesis. In Figure 3, we calculated our p-value of 0.0268, meaning we reject the null hypothesis of a lack of automobile growth in Hamhung with 97.32% confidence (see Fig. 3).
Using this equation to predict SPV growth by 2050, we could expect a tally of SPVs in the city of Hamhung to reach nearly 1,500.
This observed increase in SPVs has been corroborated by defector testimony. Our team was able to interview a resident of Hamhung who lived in the city in the previous five years. In discussion of the taxi services in Hamhung, they indicated that the number of taxis rose dramatically after 2018 and that most taxis in Hamhung were white. This information corresponds with our data, and many of the SPVs (perhaps a majority) counted after 2018 were white.
The interviewee used taxis frequently and reported paying around $4 USD per ride, nearly an average day’s official salary in North Korea. Considering this high price, and considering the increase in SPVs, this would indicate some level of economic growth in Hamhung.Interview secured by the University of Wisconsin’s Center for East Asian Studies in Spring 2024.[6]
Modest Upgrades to Transportation Infrastructure
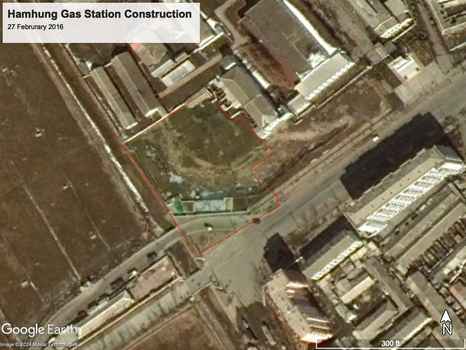
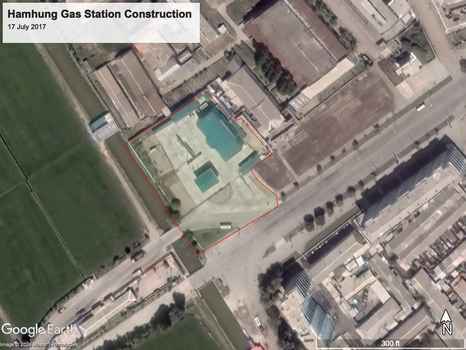
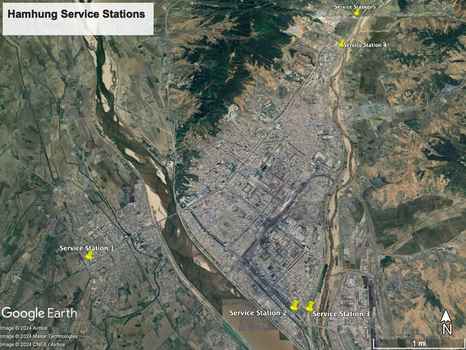
Accompanying the increase in SPVs, our team has noted some modest improvements in Hamhung’s transportation infrastructure over the period. Hamhung appears to have added at least four gas stations since 2007 for a total of five in the city.We have identified four gas stations within our count area and one just across the Seongcheong River to the southwest.[7] Three of these have been added since 2016 (see exemplar below), and one older station was significantly expanded in 2019.This would be consistent with a trend that shows increases in gas stations around North Korea since 2016. See Jacob Bogle, “Fueling the country: tracking North Korea’s growing number of gas stations,” North Korea Professional Research Platform, October 11, 2019, https://www.nknews.org/pro/fueling-the-country-tracking-north-koreas-growing-number-of-gas-stations/, Accessed June 5, 2024. Bogle claims there are seven gas stations in Hamhung, though his search probably included the port area of Hungnam, See Jacob Bogle, “Kim Jong-un’s First Decade - Gassing Up the Country,” AccessDPRK, September 1, 2021, https://mynorthkorea.blogspot.com/2021/09/kim-jong-uns-first-decade-gassing-up.html, Accessed June 5, 2024.[8]
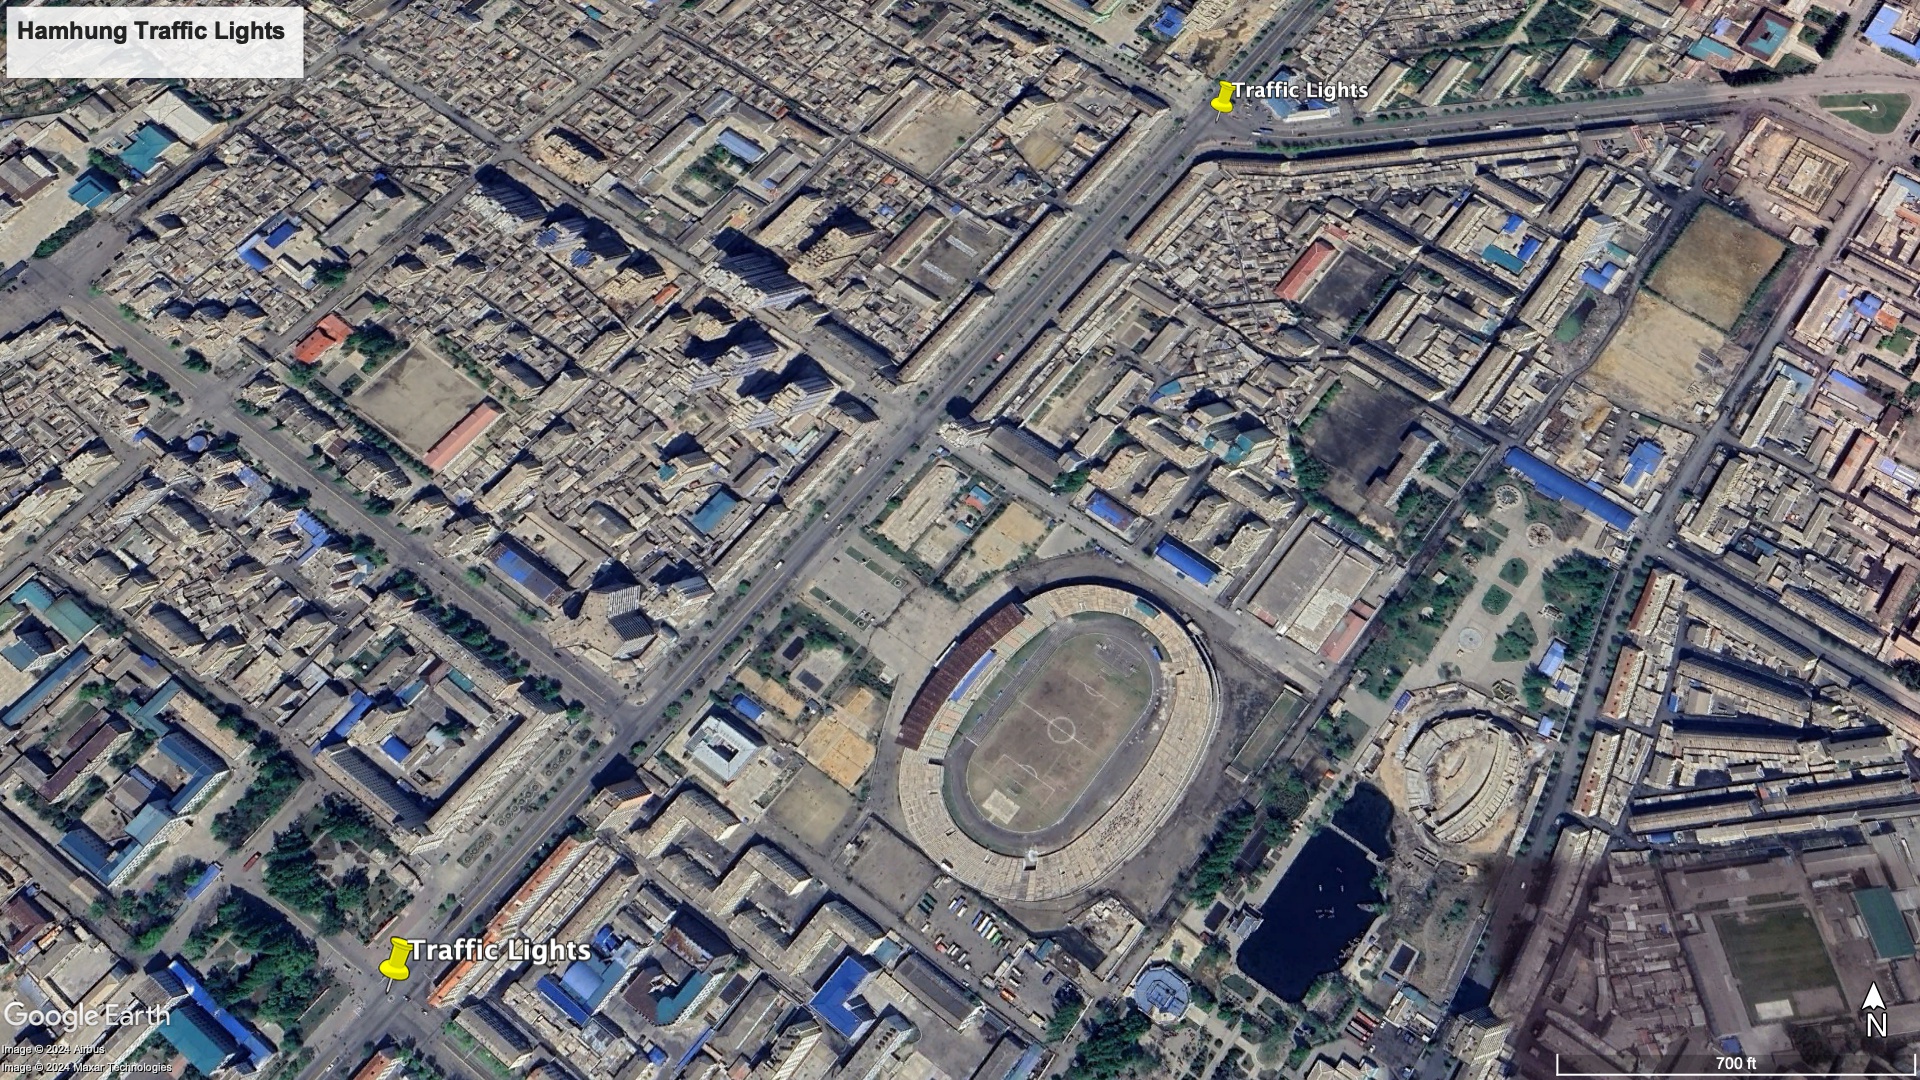
According to 38 North.org, Hamhung received its first traffic light in 2019 at the intersection of Asian Highway 6 and the road leading south to Hamhung Station.Location of the first traffic signal is 39°55'6.57'N, 127°32'2.69'E. See Martyn Williams, “North Korea’s Ever-Expanding Red-Light Camera and Traffic Light Network,” 38 North, Stimson Center, February 26, 2021, https://www.38north.org/2021/02/north-koreas-ever-expanding-red-light-camera-and-traffic-light-network/, Accessed June 5, 2024[9] Our analysis indicates that a second traffic light was added on Asian Highway 6 one kilometer further to the northwest by mid-2020. However, painted traffic circles—which are occasionally manned—in the middle of both intersections may indicate that these traffic lights are routinely out of operation. These traffic light intersections may be seen below.
Despite a modest increase in SPVs, the parking infrastructure of Hamhung appeared unchanged and was characterized by an almost complete lack of lined parking lots. Except for the parking lot outside of the Shinhungsan Hotel, there does not appear to be another lined parking lot in the entire city.This parking lot (39°54'53.40'N, 127°31'42.27'E) was lined in November 2013 and re-lined in February 2020.[10] While SPVs are regularly parked in the lot northeast of the Hamhung Stadium and in the lot northeast of Hamhung Station, neither of these lots are lined. These lines are shown below in the parking lot region nearest to the road.
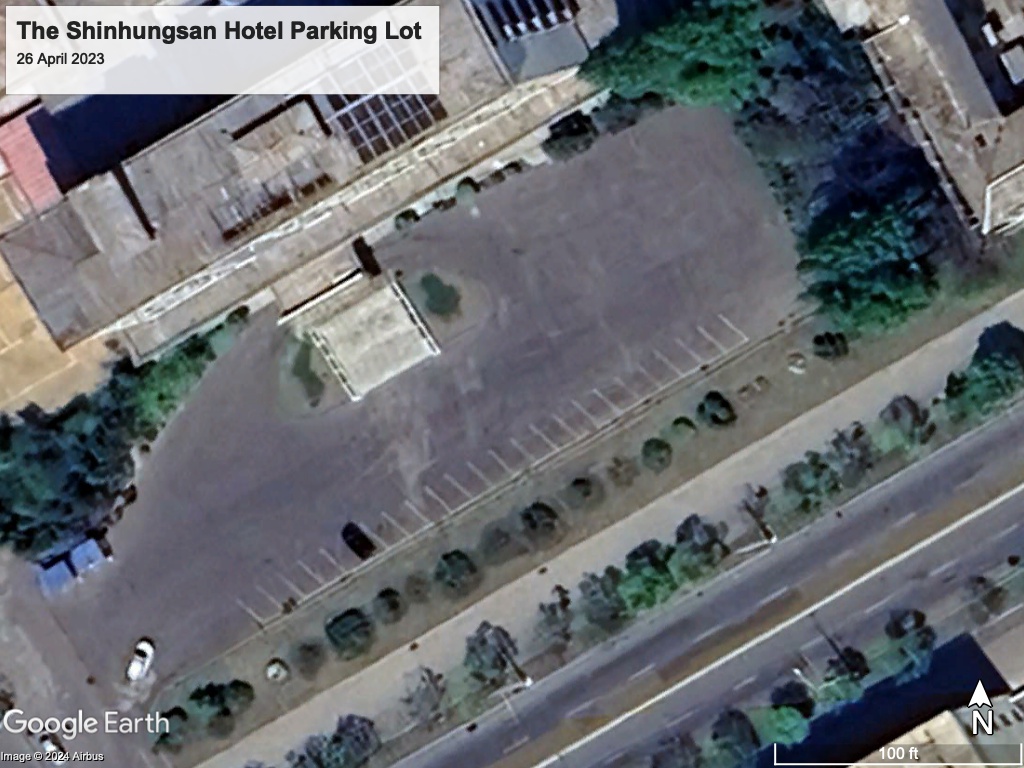
Hamhung’s single lined parking lot compares unfavorably with the city of Rason, which has four small lined parking lots, despite having half the population of Hamhung, though cursory searches of North Korean cities indicate that lined parking lots are rare outside of Pyongyang and the Kaesong Industrial Complex. The Shinhungsan Hotel, which is open to foreign tourists, may have lined its parking lot in order to generate revenue by charging for parking, as other North Korean entities have done. Though the hotel lot is lined to accommodate 28 vehicles, our team never observed more than five vehicles parked in the lot.
Although it was outside of our focus on SPVs, our team did notice significant development related to trucking within our area of interest. Since 2017, four locations within the city center have been converted from vacant lots or agricultural land into walled compounds featuring large warehouses and yards presumably used for loading and unloading large trucks. The series of before and after images below visualizes this development.
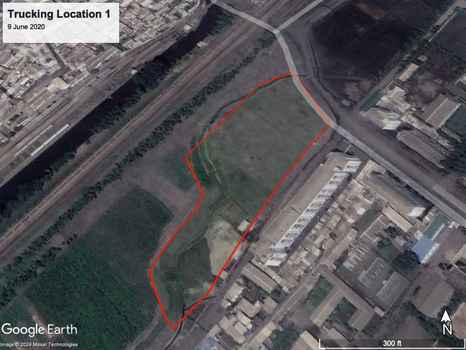
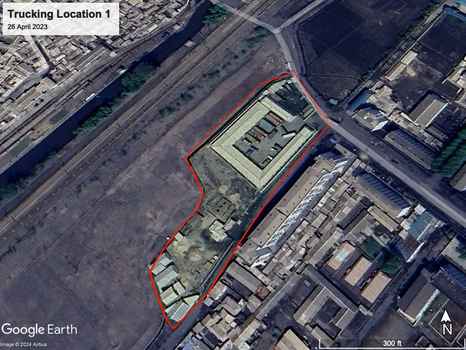
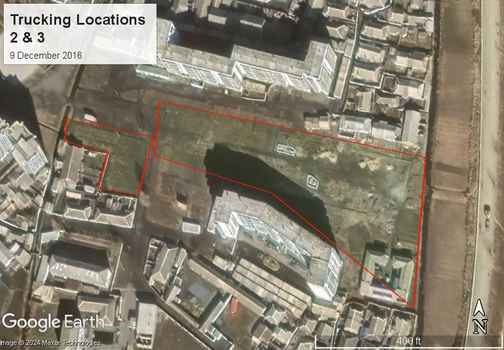
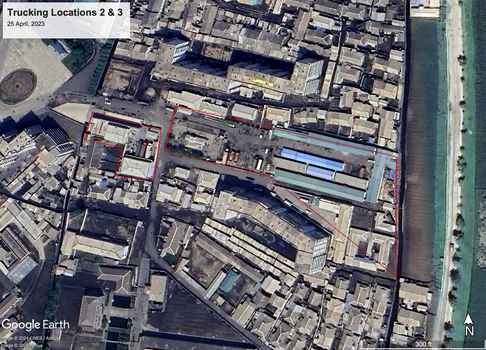
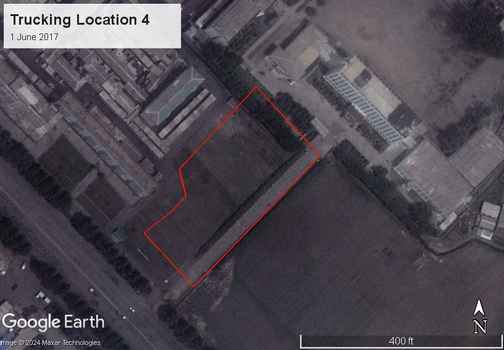
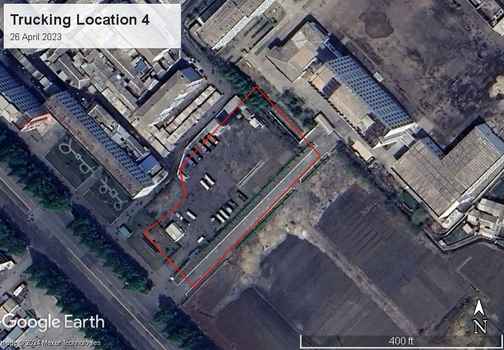
While it is uncertain just what sort of activity these four locations are engaged in, it would appear their development has added to the trucking capacity within Hamhung.
Widely Cited Figure of Total Numbers of Vehicles in North Korea is likely an Underestimate
Discussions of the car industry in North Korea frequently include an estimate of 30,000 total vehicles of all types.See Sebastian Bell, “The History of North Korea’s Automotive Industry is Full of Secrets and Copycats,” Carscoops, January 21, 2022, https://www.carscoops.com/2022/01/the-history-of-north-koreas-automotive-industry-is-full-of-secrets-and-copycats/, Accessed June 5, 2024; Justin Berkowitz, “Cars from North Korea: Axis of Evil,” Car and Driver, August 13, 2010, https://www.caranddriver.com/features/a15127278/cars-from-north-korea-features/, Accessed June 5, 2024; Donut Media, “Inside North Korea’s Hidden Car Industry,” January 31, 2022, Donut Media, https://www.youtube.com/watch?v=O7kRQ5WCkpU&ab_channel=Donut, Accessed June 6, 2024; Tasos Kokkinidis, “North Korea Is the Culprit of the Largest Car Theft in History,” Greek Reporter, November 9, 2023, https://greekreporter.com/2023/11/09/north-korea-largest-car-theft-history/#:~:text=With%20a%20population%20of%20over,spotted%20in%20the%20capital%20Pyongyang, Accessed June 6, 2024.[11] Although the exact source of this number is unclear—mentions of it never include citations—it may originate from a 2007 interview with North Korea expert Andrei Lankov in which he offered an estimate of 20,000 to 25,000 total “passenger cars” in the entire country. This estimate of 30,000 could also be a misreporting of the total production output capacity of the North Korean automotive industry, which has long been estimated at 30-35,000 vehicles per year, though nearly all observers believe the industry has only operated at a fraction of this capacity.See Ko Soo-Suk, “Sanctions could effect North Korea’s auto industry,” Korea JoongAng Daily, February 18, 2016, https://koreajoongangdaily.joins.com/2016/02/18/politics/Sanctions-could-effect-North-Koreas-auto-industry/3015237.html, Accessed June 6, 2024; KNCA News Agency, “Summary of World Broadcasts Third Series (September 8, 1993),” in Readex: BBC Monitoring: Summary of World Broadcasts, translated by BBC, https://infoweb-newsbank-com.ezproxy.library.wisc.edu/apps/readex/doc?p=BBCWBX&docref=image/v2%3A18BAE7B08A006A2B%40BBCWBX-1926C77736BECE3D%402449239-19250F448140D59B%4012, Accessed June 6, 2024[12] Except in the case of Lankov above, it is also unclear whether this figure of 30,000 is just an estimate of cars, or all motor vehicles.
While this figure of 30,000 is widely reported, other estimates are available. Nicholas Eberstadt reported an unnamed US government official as estimating 260,000 vehicles of all types (including military vehicles) in North Korea in 1990.Nicholas Eberstadt, “North Korea’s Interlocked Economic Crises: Some Indications from ‘Mirror Statistics,’” Asian Survey 38, no. 3 (1998): 203–30, https://doi.org/10.2307/2645426, Accessed June 6, 2024[13] Statistics Korea—a South Korean government Agency—has reported on average 270,000 vehicle registrations (자동차 등록) per year since 2013, though it is unclear what the source of this data is.See https://kosis.kr/bukhan/nkStats/nkStatsIdctChart.do?menuId=M_01_02&listNm=%EA%B5%90%ED%86%B5%2F%EB%AC%BC%EB%A5%98 The source is an unnamed “North Korean entity” [(북)관계기관].[14]
Analysis done by our team makes it possible to offer an estimate of SPVs per capita in North Korea based on actual survey data, and this methodology could be expanded to estimate other vehicle types per capita. However, our estimate comes with three important caveats.
First, any population statistics for North Korea are just estimates themselves since North Korea has conducted very few censuses throughout its history, and many of them have not been up to international standards.For an excellent overview of North Korean Statistics, See NK News, interview with Nicholas Eberstadt, North Korea News Podcast, podcast audio, September 24, 2019, https://www.nknews.org/category/north-korea-news-podcast/older-podcasts/making-sense-of-north-koreas-messy-statistics-nknews-podcast-ep-97/865146/, Accessed June 6, 2024[15]
Second, all of the data our team has generated is almost certainly an undercount since we only counted visible SPVs in Hamhung. Even working with ideal imagery, shadows, foliage, and cloud cover obscured many vehicles.
Third, surveys only included SPVs. Large buses, trucks, and cargo vehicles of all kinds were not included in our counts, and many estimates may be including these other vehicle types.
SPVs Per Capita in Hamhung and North Korea
Using the United Nations estimate of 544,000 for the population of Hamhung in 2024 and an average of the SPVs counted over our nine survey days (427), we estimate there is 1 SPV for every 1,274 residents. Assuming that Hamhung represents non-rural areas of North Korea with cars and that North Korea has a population of 26 million people, we would estimate the total number of SPVs to be 20,408, or 0.784 per 1,000 people. We understand that most rural areas of North Korea lack SPVs, so Hamhung, wealthier than most North Korean cities, should represent a middle ground between completely rural areas and the city of Pyongyang (another assumption) where SPVs are likely overrepresented. We understand this is a seemingly wide assumption, but given scant internal economic data and primary sourced data from imagery on North Korean topics, we wanted to socialize a new figure that can be refined over time.
Since we believe our data represents an undercount, we ran the same calculation again only instead of using the average of all survey days, we used the survey day with the highest number of SPVs counted (4/25/2023, 723 SPVs). This calculation would indicate the total number of SPVs in North Korea to be 34,555, or 1.329 per 1,000 people.
Our analysis indicates that the figure of 30,000 vehicles for all of North Korea is almost certainly an underestimate if it is meant to include all motor vehicles, but it may be approximately accurate if it is meant just to apply to SPVs.
Conclusion
We hope that our calculations of SPVs per capita will become a methodological base or partial base for how future estimates of various types of motor vehicles in North Korea are calculated.
Such data is not just valuable as proxy data on the North Korean economy, but over time could be used to corroborate other sorts of analysis of the North Korean regime. For example, our analysis seems to corroborate reports that car “ownership” (access to vehicles) has been on the rise in North Korea in recent years. A steady increase in vehicles per capita in North Korea in the future could indicate an inability of the regime to police vehicle usage or, more hopefully, a relaxation of the restrictions that makes vehicle usage LESS onerous and expensive. In either case, such information would be helpful in gauging the intentions and health of the regime. As one of our team members has written elsewhere, internal restrictions on mobility and the decrepit state of North Korea’s transportation infrastructure are as much, if not more, of a constraint on North Korea’s economic growth than international sanctions. Monitoring North Korea’s transportation infrastructure would be a way of knowing if such constraints are being addressed.
Contributor Note
This article benefitted tremendously from the authorship of an additional University of Wisconsin-Madison student who wishes to remain anonymous. Please contact Dr. David Fields for Curriculum Vitae (CV) credit questions.
Graphs
Figure 1.
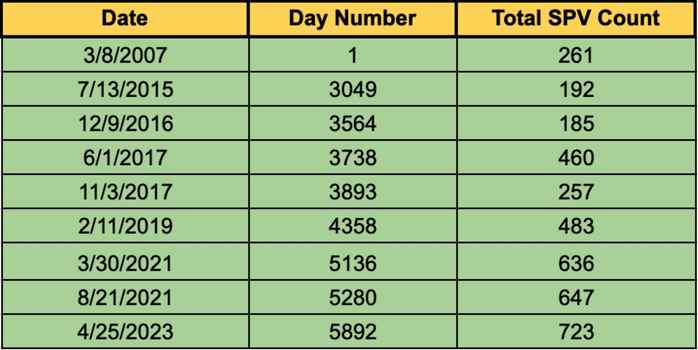
Fig. 1: This 3-column table displays the total SPV count over 9 separate counting days. The dates in the leftmost column were converted to set the first counting day as day 1. This conversion helps us to visualize the time between each of the counting days to more accurately visualize, to scale, the change in SPV numbers over 16 years.
Figure 2.
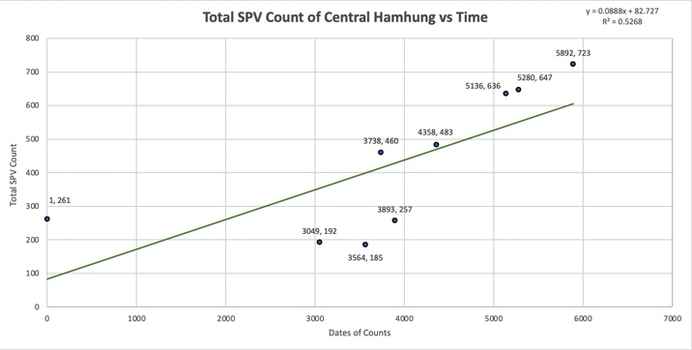
Fig. 2: The above plot displays the growth in total counts of SPVs over 16 years in Hamhung where dates are defined as day numbers. Using Google Earth Pro software, tallies of SPV counts in the defined border of central Hamhung were generated and plotted. Then, performing a simple linear regression in Microsoft Excel, we determined the equation for our line of best fit and its R² value.
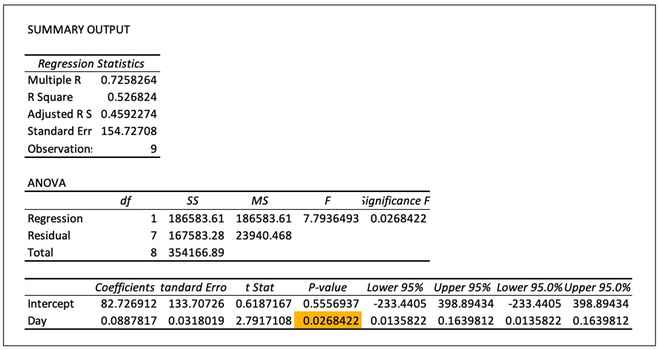
Fig. 3: Using the Pearson Correlation Coefficient equation, we determined an R value used to generate a p-value to determine the significance of our correlation of days and SPV growth. Highlighted in yellow, our p-value indicates we are over 97% confident that our correlation is not due to random chance.
Look Ahead
In the future, our team plans to conduct a similar survey of vehicles in Pyongyang and other North Korean cities to continue to refine our understanding of North Korean motor vehicle numbers. We acknowledge this initial case study was based on exquisite commercial imagery and conditions. In the future, we aim to apply our CV and manual methods against less exquisite commercial imagery standards and conditions that will increase the sample size.
Things to Watch
- Are new services stations being added?
- Are additional parking lots being lined?
- Are traffic lights being added?
- Are inter-city roads and highways being paved?
- Next report on Pyongyang coming soon......


