
Summary
The application of a basic geographic information system (GIS) workflow and cloud-based processing of publicly available Sentinel-1 synthetic aperture radar (SAR) images, within a Google Earth Engine environment, demonstrates the ability to track large maritime vessel activity patterns on the Taedong River proximal to Nampo Port in Nampo, Democratic People's Republic of Korea (DPRK) with a high degree of accuracy. This maritime vessel activity was observed over a period of 10 years (2015-2025). The automated methodology utilized to analyze this activity has no statistically significant bias (95% CI -0.22 – 0.45) with a mean absolute error of 0.81 ships per image across the entire area of interest.
Analysis identified multiple temporal points of interest where there were significant changes in maritime activity, providing quantitative context for further in-depth qualitative research. The automated methodology described can be replicated on other ports or narrow maritime areas of interest to generate contextual quantitative data on large vessel movements and activity over long time periods.
Background
Use of SAR for Maritime Surveillance
Applications of remote sensing—and SAR data analysis, in particular—for automated maritime activity surveillance have been extensively researched, and various algorithms have been developed in academic and operational settings for detailed vessel identification and classification. For example, the European Commission's Joint Research Center Search for Unidentified Maritime Objects (SUMO) program has been intensively developed for this purpose across a range of SAR data sources.Greidanus, Harm, Marlene Alvarez, Carlos Santamaria, François-Xavier Thoorens, Naouma Kourti, and Pietro Argentieri. “The SUMO Ship Detector Algorithm for Satellite Radar Images.” Remote Sensing 9, no. 3 (March 7, 2017): 246. https://doi.org/10.3390/rs9030246[1] More complex tools such as these are invaluable, especially when analyzing wide geographic areas or when the highest-precision measurements are imperative. However, less technical research teams who require contextual quantitative data on large vessel maritime activity may be hampered in implementing complex tools by a lack of technical resources, limited compute, or cost barriers to purchasing pre-processed data. These users require a simple, low-cost option to generate data that maintains a reasonably high level of accuracy and precision.
The methodology described below fulfills this need, enabling a less technical research team to easily generate contextual large vessel maritime activity data used for cross-referencing qualitative findings, providing background information, or other auxiliary purposes in a broader analysis of a specific site where absolute precision is not as critical as capturing overall patterns. In this case, Nampo Port in the DPRK was used as an area of interest for a geographically narrow longitudinal analysis of large vessel activity. The results of the approach were used as supporting data alongside more detailed qualitative analyses of infrastructure upgrades at the port.
Nampo Port
Nampo Port, situated about 15 kilometers upriver from the West Sea Barrage, serves as the DPRK's primary port on the Yellow Sea. It consists of multiple distinct sections, including a container terminal (the DPRK's only container terminal on its western coast), a bulk goods terminal that handles mixed goods as well as coal, and a petroleum, oil, and lubricants (POL) storage area and terminal. It is a key multimodal trade hub with both rail and truck transport options to move goods into and out of the port area.
Due to its location and strategic importance to the DPRK economy, trade activity at the port has been the subject of research by various think tanks and research groups.Byrne, Joe, James Byrne, and Giangiuseppe Pili. “North Korea's Oil Terminals Come back to Life as Imports Breach UNSC Cap.” Rusi.org, 2021. https://www.rusi.org/explore-our-research/publications/commentary/north-koreas-oil-terminals-come-back-life-imports-breach-unsc-cap.[2]Williams, Martyn, and Peter Makowsky. “Nampho Container Port Remains Active Despite Continued Border Closures - 38 North: Informed Analysis of North Korea.” Edited by 38North/Stimson Center. 38 North, February 2, 2021. https://www.38north.org/2021/02/nampho-container-port-remains-active-despite-continued-border-closures/[3] However, the majority of these analyses often rely primarily on qualitative methods to measure changes in activity, using small numbers of manually interpreted satellite images. While manually interpreted methods are highly accurate and provide in-depth analysis over a small timeframe, the addition of automated analysis of large vessel activity over a longer period would enable a more comprehensive understanding of activity at Nampo Port.
Method
Overview and Data Sources
This methodology has been refined and simplified into the fewest possible number of operations to accomplish the objective of detecting large vessels within an area of interest. The simplified methodology still achieves high accuracy and precision, as detailed in the following section. This methodology uses Sentinel-1 Ground Range Detected (GRD) SAR imagery in vertical transmit, horizontal receive (VH) polarization acquired in Interferometric Wide (IW) mode. The specific boundaries of vessel grouping areas around each of the three major port terminals were defined by the researcher as vector polygons.
Analytical Process
The analytical process for quantifying maritime activity within an area of interest is encapsulated in a four-step approach. The following procedures were executed using JavaScript on an initial dataset of all Sentinel-1 images captured since 2015. All of these procedures were performed in a single Google Earth Engine script.
1. Image Collection Filtering
The collection of all Sentinel-1 GRD IW VH images is filtered to a set of 494 valid images that a) were captured between 1/1/2015 - 9/1/2025; b) intersect an area of interest point at 38.6949°N, 125.3208°E; and c) were not captured during the months of January or February. The exclusion of certain months is applied due to overdetection during periods of heavy ice on the Taedong River, which is discussed further in the Analytic Confidence section.
2. Binary Mask Generation and Clipping
For each image in the filtered collection, a binary mask is generated where pixels with VH backscatter values >= -20 dB are assigned values of 1 and all other pixels are assigned values of 0. This binary mask is then clipped to the extent of the river itself using a manually created polygon of the water extent. This step produces a binary image of high backscatter clusters on the river for every image.
3. Cluster Vectorization and Filtering
For each binary image, every contiguous cluster of high backscatter pixels is reduced to a unique vector object. Vectors that have total sizes smaller than 15px or larger than 200px are filtered out. This controls for most artifacts and removes any small vessels outside the scope of the analysis. This step produces a set of likely ship vector objects for every image.
4. Terminal Grouping
Based on the researcher’s expertise and long-term pattern observation of ship clustering locations, approximate polygons were developed around each of the three main terminals to include areas of the river in which any vessels were likely approaching or departing the given terminal. Separate large vessel vector counts were then generated for every image for each of the following sub-areas:
- Approach to the West Sea Barrage
- Entire River Adjacent to Nampo Port
- POL Terminal Proximal Area
- Bulk Goods and Coal Terminal Proximal Area
- Container Terminal Proximal Area
- Upriver Areas (From Nampo to Chollima)
Application
This methodology can be applied to any maritime area of interest with regular Sentinel-1 SAR imagery coverage to generate relatively high accuracy vessel detection counts over time. It is effective specifically for detecting large vessels (in this case, for example, tanker and container ships) which is a function of the spatial resolution of Sentinel-1 data. At 5x20m/px spatial resolution, smaller vessels are generally not detectable.
Certain areas of interest—like Nampo Port—are especially good candidates for this methodology based on specific spatial characteristics. The following three spatial characteristics aid in the implementation of this methodology, but are not required in their entirety to employ the automated methodology. First, there is a clearly definable maritime boundary for the area of interest. Because vessels entering the Taedong River must transit the West Sea Barrage, it can be used as a boundary for the extent of the river to monitor. Determining this boundary may be more difficult and potentially ambiguous at, for example, a port exposed directly to the ocean. Second, each specific terminal is spaced far enough apart that vessels cluster into obvious groups during their approach and departure. This makes the methodology more valuable since it allows trends related to specific terminals to be measured. Third, the upriver areas can also be clearly bounded and vessel traffic in them quantified. This is important because it enables the researcher to more confidently demonstrate that changes in patterns near Nampo Port are actually due to changes in traffic at the port itself and not vessels traveling upriver merely passing by.
Google Earth Engine was used to implement the methodology because of the ability to process imagery in the cloud, reducing compute requirements on the researcher’s device and making it feasible to quickly deploy the methodology against any area of interest.
All data and systems used to deploy this methodology are fully accessible to researchers at no cost. Sentinel-1 SAR imagery is free and openly accessible through the European Union’s Copernicus program.European Space Agency. “Copernicus Programme.” sentiwiki.copernicus.eu, n.d. https://sentiwiki.copernicus.eu/web/copernicus-programme[4] Google Earth Engine is free for most nonprofit organizations and academic research institutions when used for non-commercial purposes.Google. “Noncommercial – Google Earth Engine.” Google.com, 2025. https://earthengine.google.com/noncommercial/[5]
Analytic Confidence
The principal advantage of this methodology is that it includes a limited number of computationally simple operations while maintaining very high accuracy and precision in detecting large vessels. The methodology was evaluated by randomly sampling a subset of 52 images from the 494 valid images analyzed by the program. For each of the 52 sampled images, all ships within the area of interest were manually counted based on Sentinel-1 imagery and any available high-resolution Planet Labs imagery captured within 30 minutes of the given Sentinel-1 image. The following statistical analysis is based on comparison of manual and automated large vessel counts for images in this random sample (n = 52).
The sample mean signed error is 0.12 ships per image. The 95% confidence interval for the mean error, using a t-based interval, is [-0.22 - 0.45] ships per image. The mean absolute error is 0.81 ships per image, indicating that, practically, the automated ship count varies by about 0.81 ships from the manual count on average for any given image. The standard deviation of error is 1.19 ships per image. In 42% of the sampled images, the program returned ship counts that matched manual counts exactly. This methodology was specifically developed for and tested against ship activity near Nampo Port, and performance may vary on significantly different problem sets.
One additional advantage of this methodology is that by using SAR data, it is largely weather agnostic and can generate usable data during periods of heavy cloud cover. This is especially important in environments like the DPRK, where significant cloud cover for large parts of the year can preclude long-term remote sensing data collection by other methods.Palka, Eugene, and Francis Galgano. “North Korea: A Geographic Analysis,” January 1, 2003. https://files.eric.ed.gov/fulltext/ED476015.pdf[6]
There are a few analytical limitations of this methodology. First, heavy ice on the Taedong River produced major artifacts that significantly disrupted accurate counting of large vessels. For this reason, all images from January or February of any year were automatically excluded. Because the objective of the methodology is to identify macro-level inflection points or changes in maritime activity, missing two months of data each year is an issue but not prohibitive to analysis. However, this methodology likely could not be implemented effectively in a location with heavy ice during a larger portion of each year. Second, because of the spatial resolution of the imagery used, any detailed classification of individual vessels beyond rough size is difficult. This methodology is useful for detecting and counting large vessels in general but does not offer more detailed information on each vessel detected.
Case Study Findings
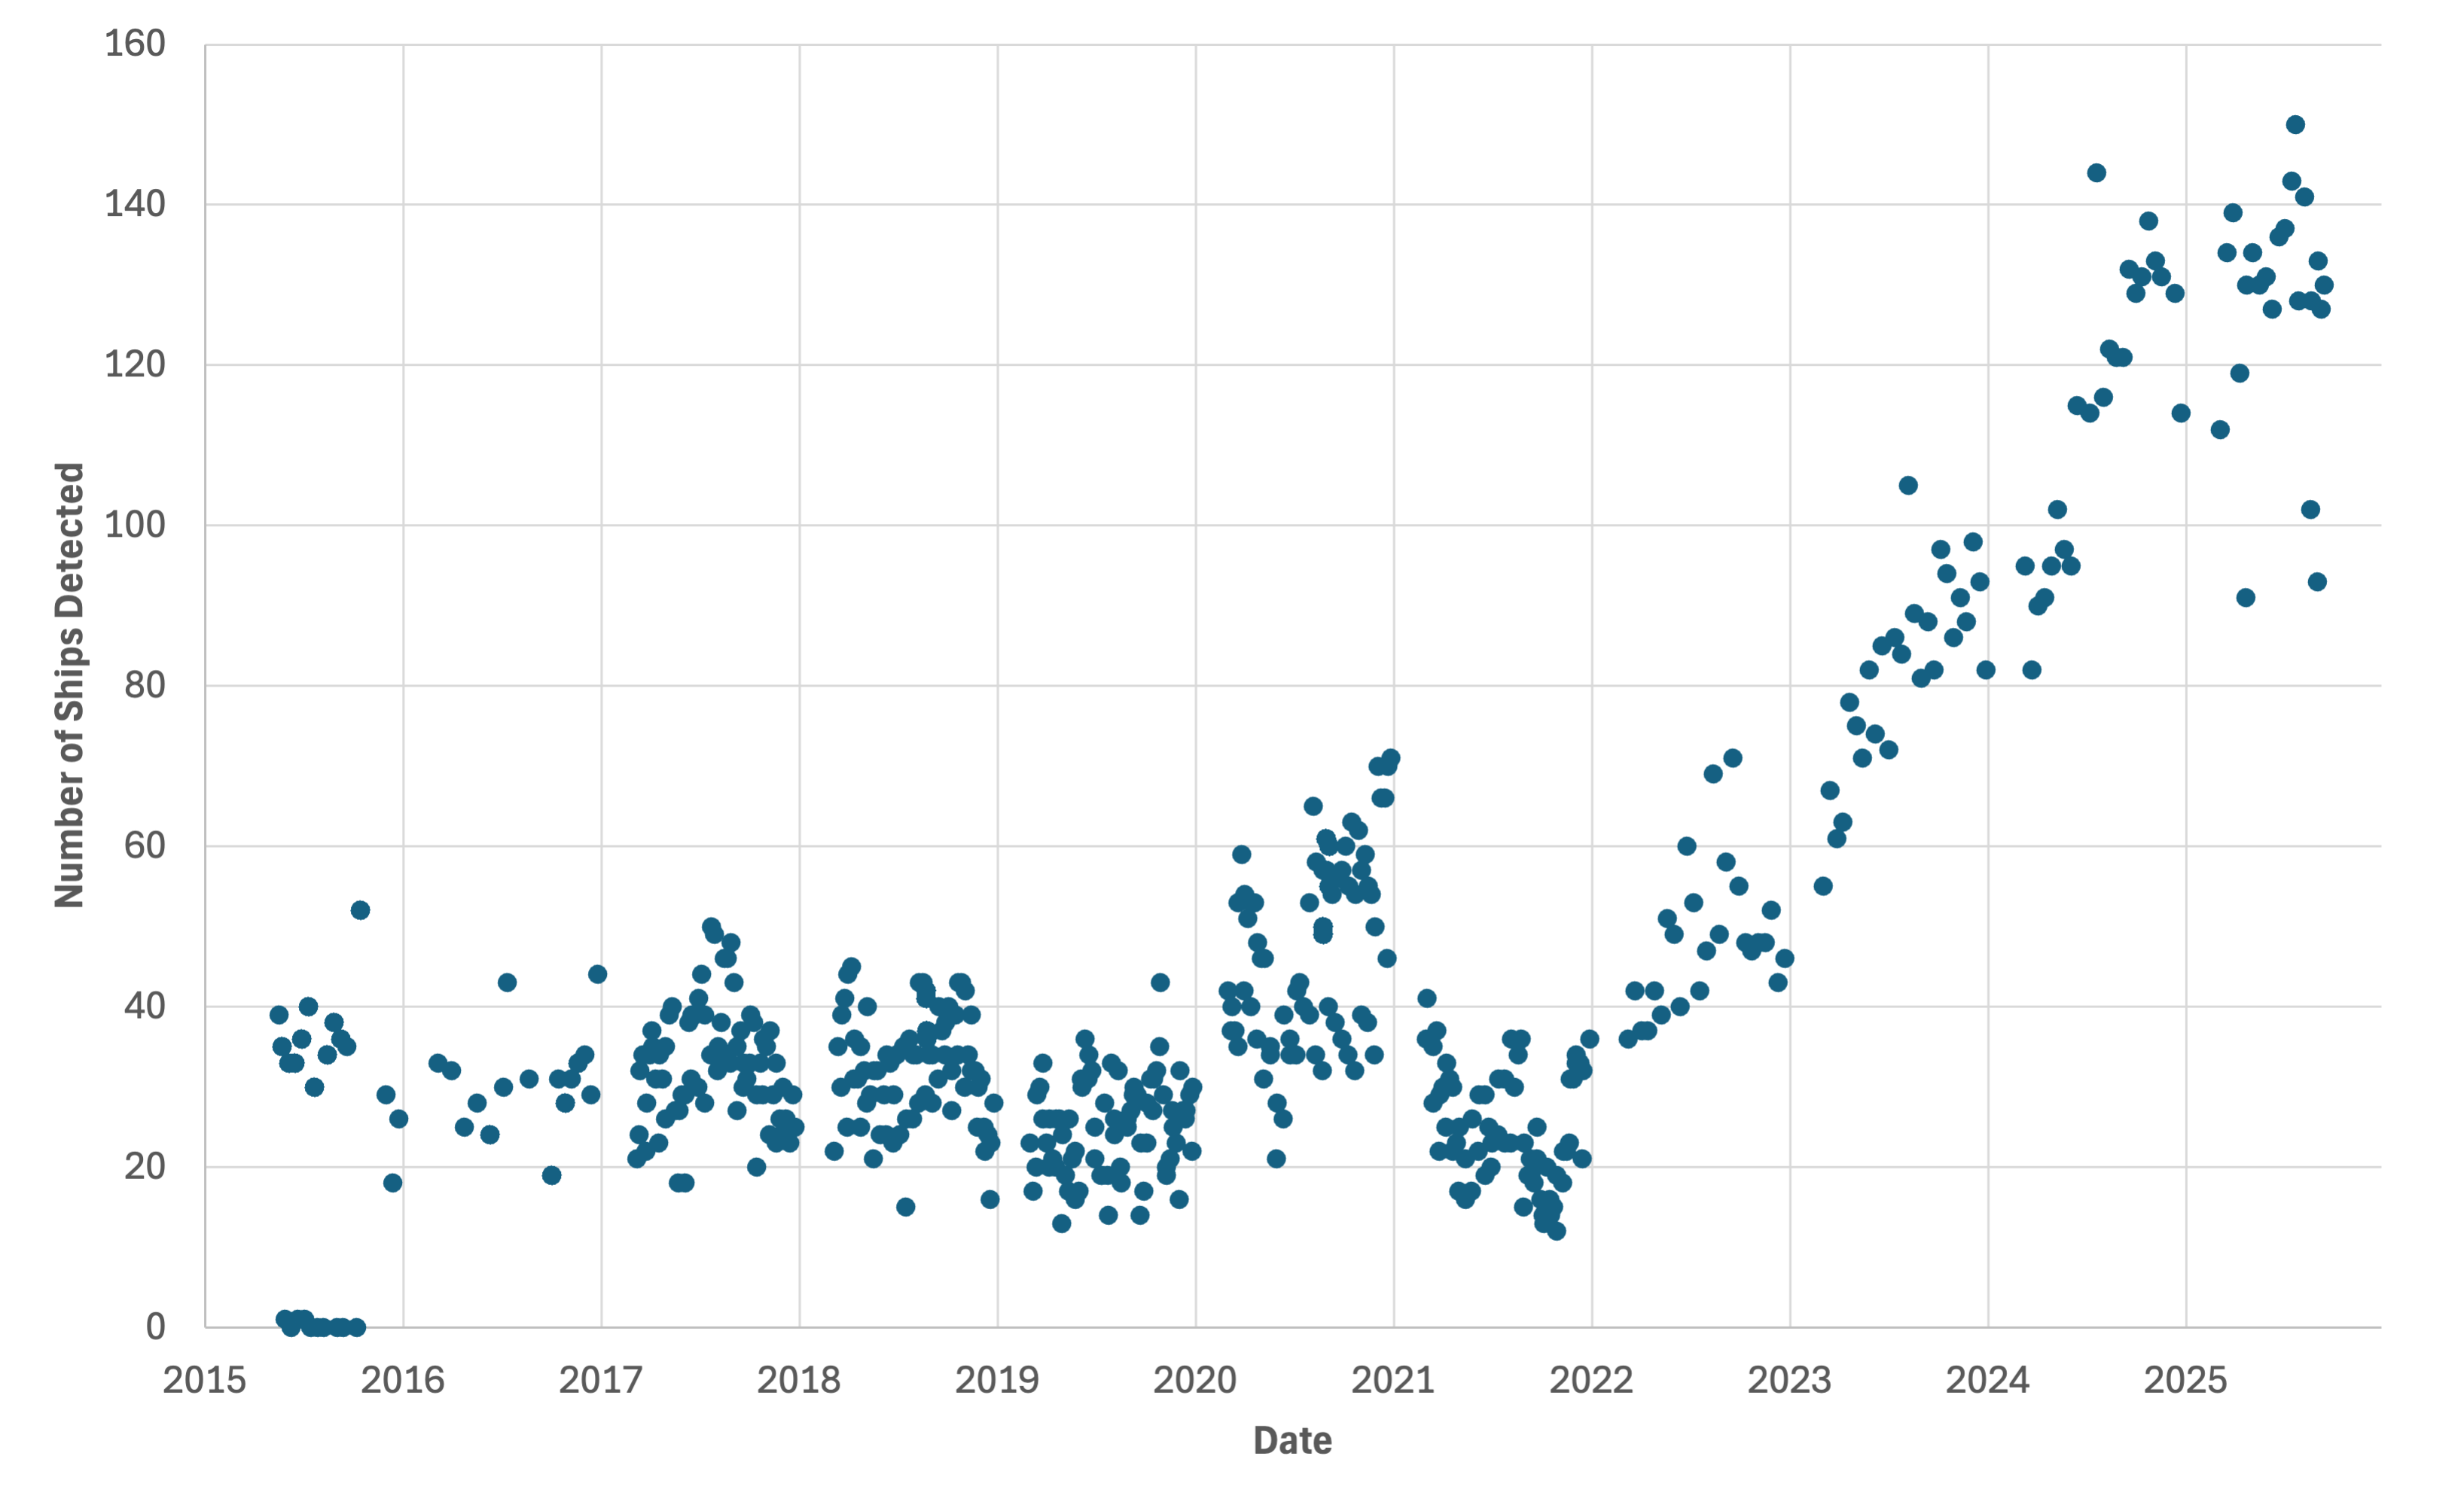
In this specific analysis, multiple temporal inflection points and periods of rapid change in maritime activity were identified for both the Nampo Port as a whole as well as specific terminals. Across the entire Taedong River from the West Sea Barrage up to Nampo Port, large vessel traffic remains relatively consistent from 2015-2019, experiences a brief increase in 2020, and then significantly increases beginning in 2022. That increase has continued for over three years, with current vessel counts ranging from 100-150 per image, a 200-300% increase from 2015-2019 levels.
Because the Taedong River continues inland, maritime activity in upriver areas from Nampo to Chollima were also analyzed to confirm that the increases detected at Nampo were not due to vessels bypassing Nampo to continue further upriver. Analysis of this area found no long-term changes in large vessel counts from 2015-2025, although there have been transitory increases and decreases throughout the period.
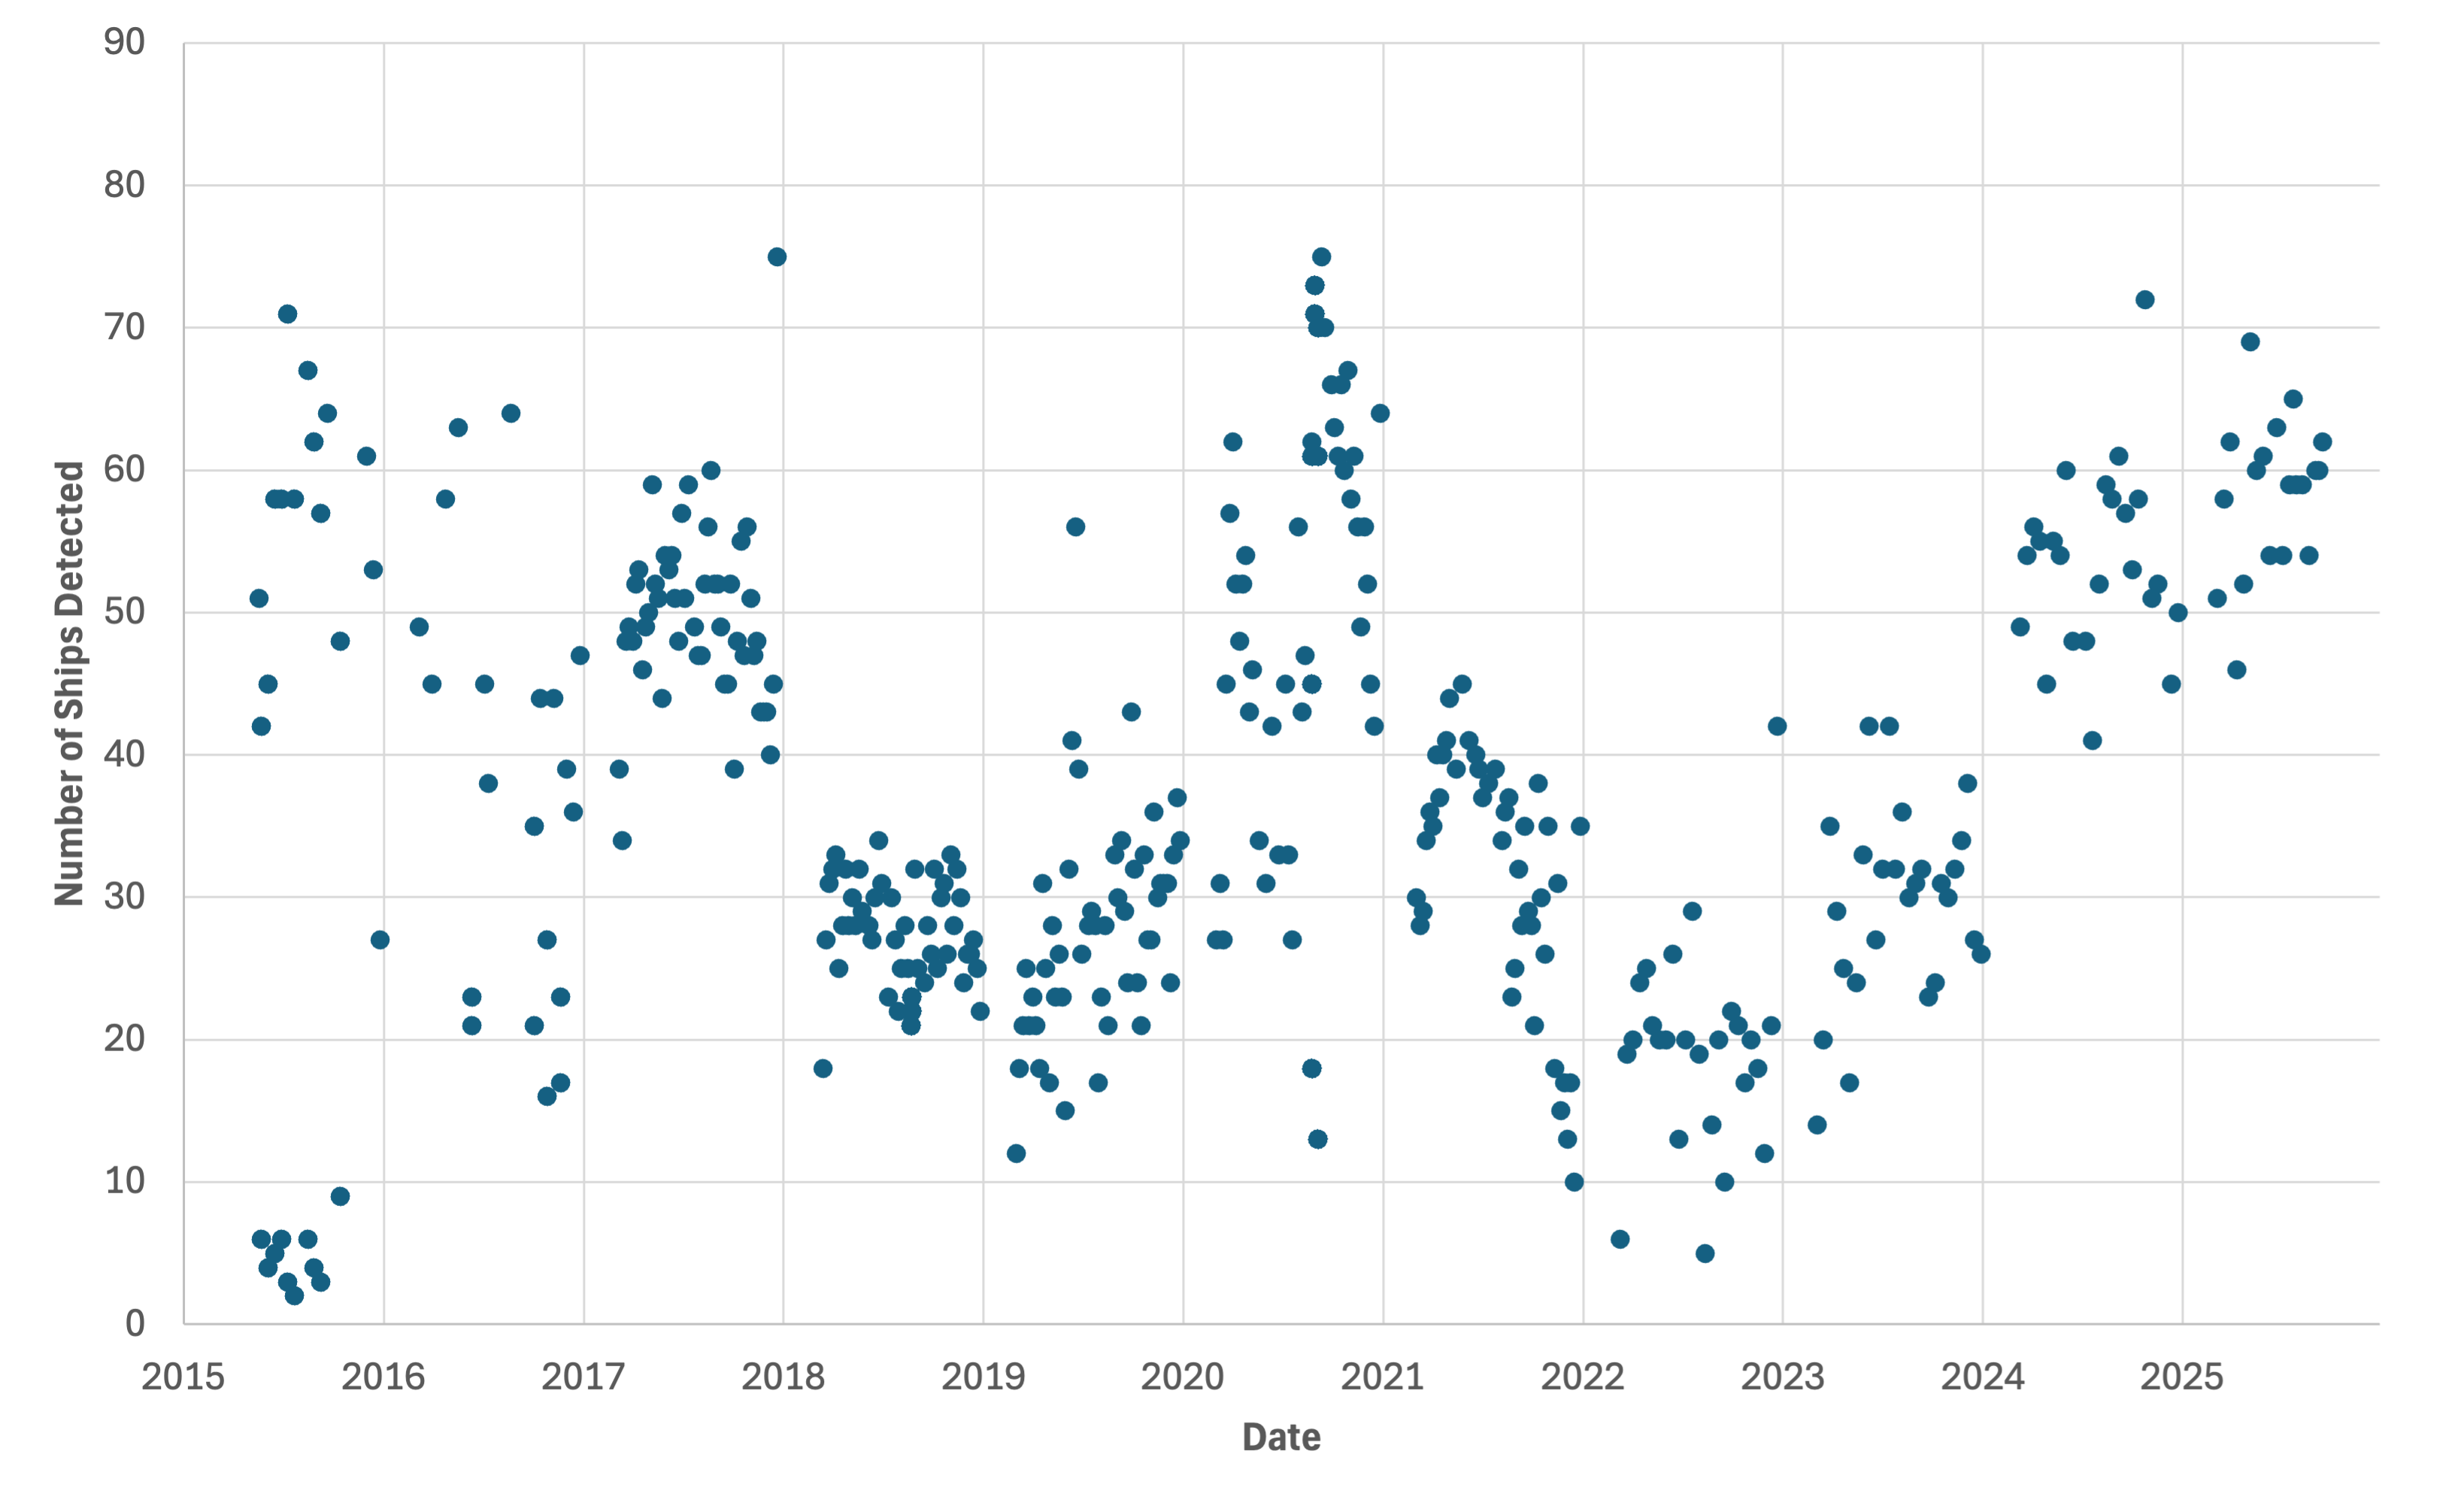
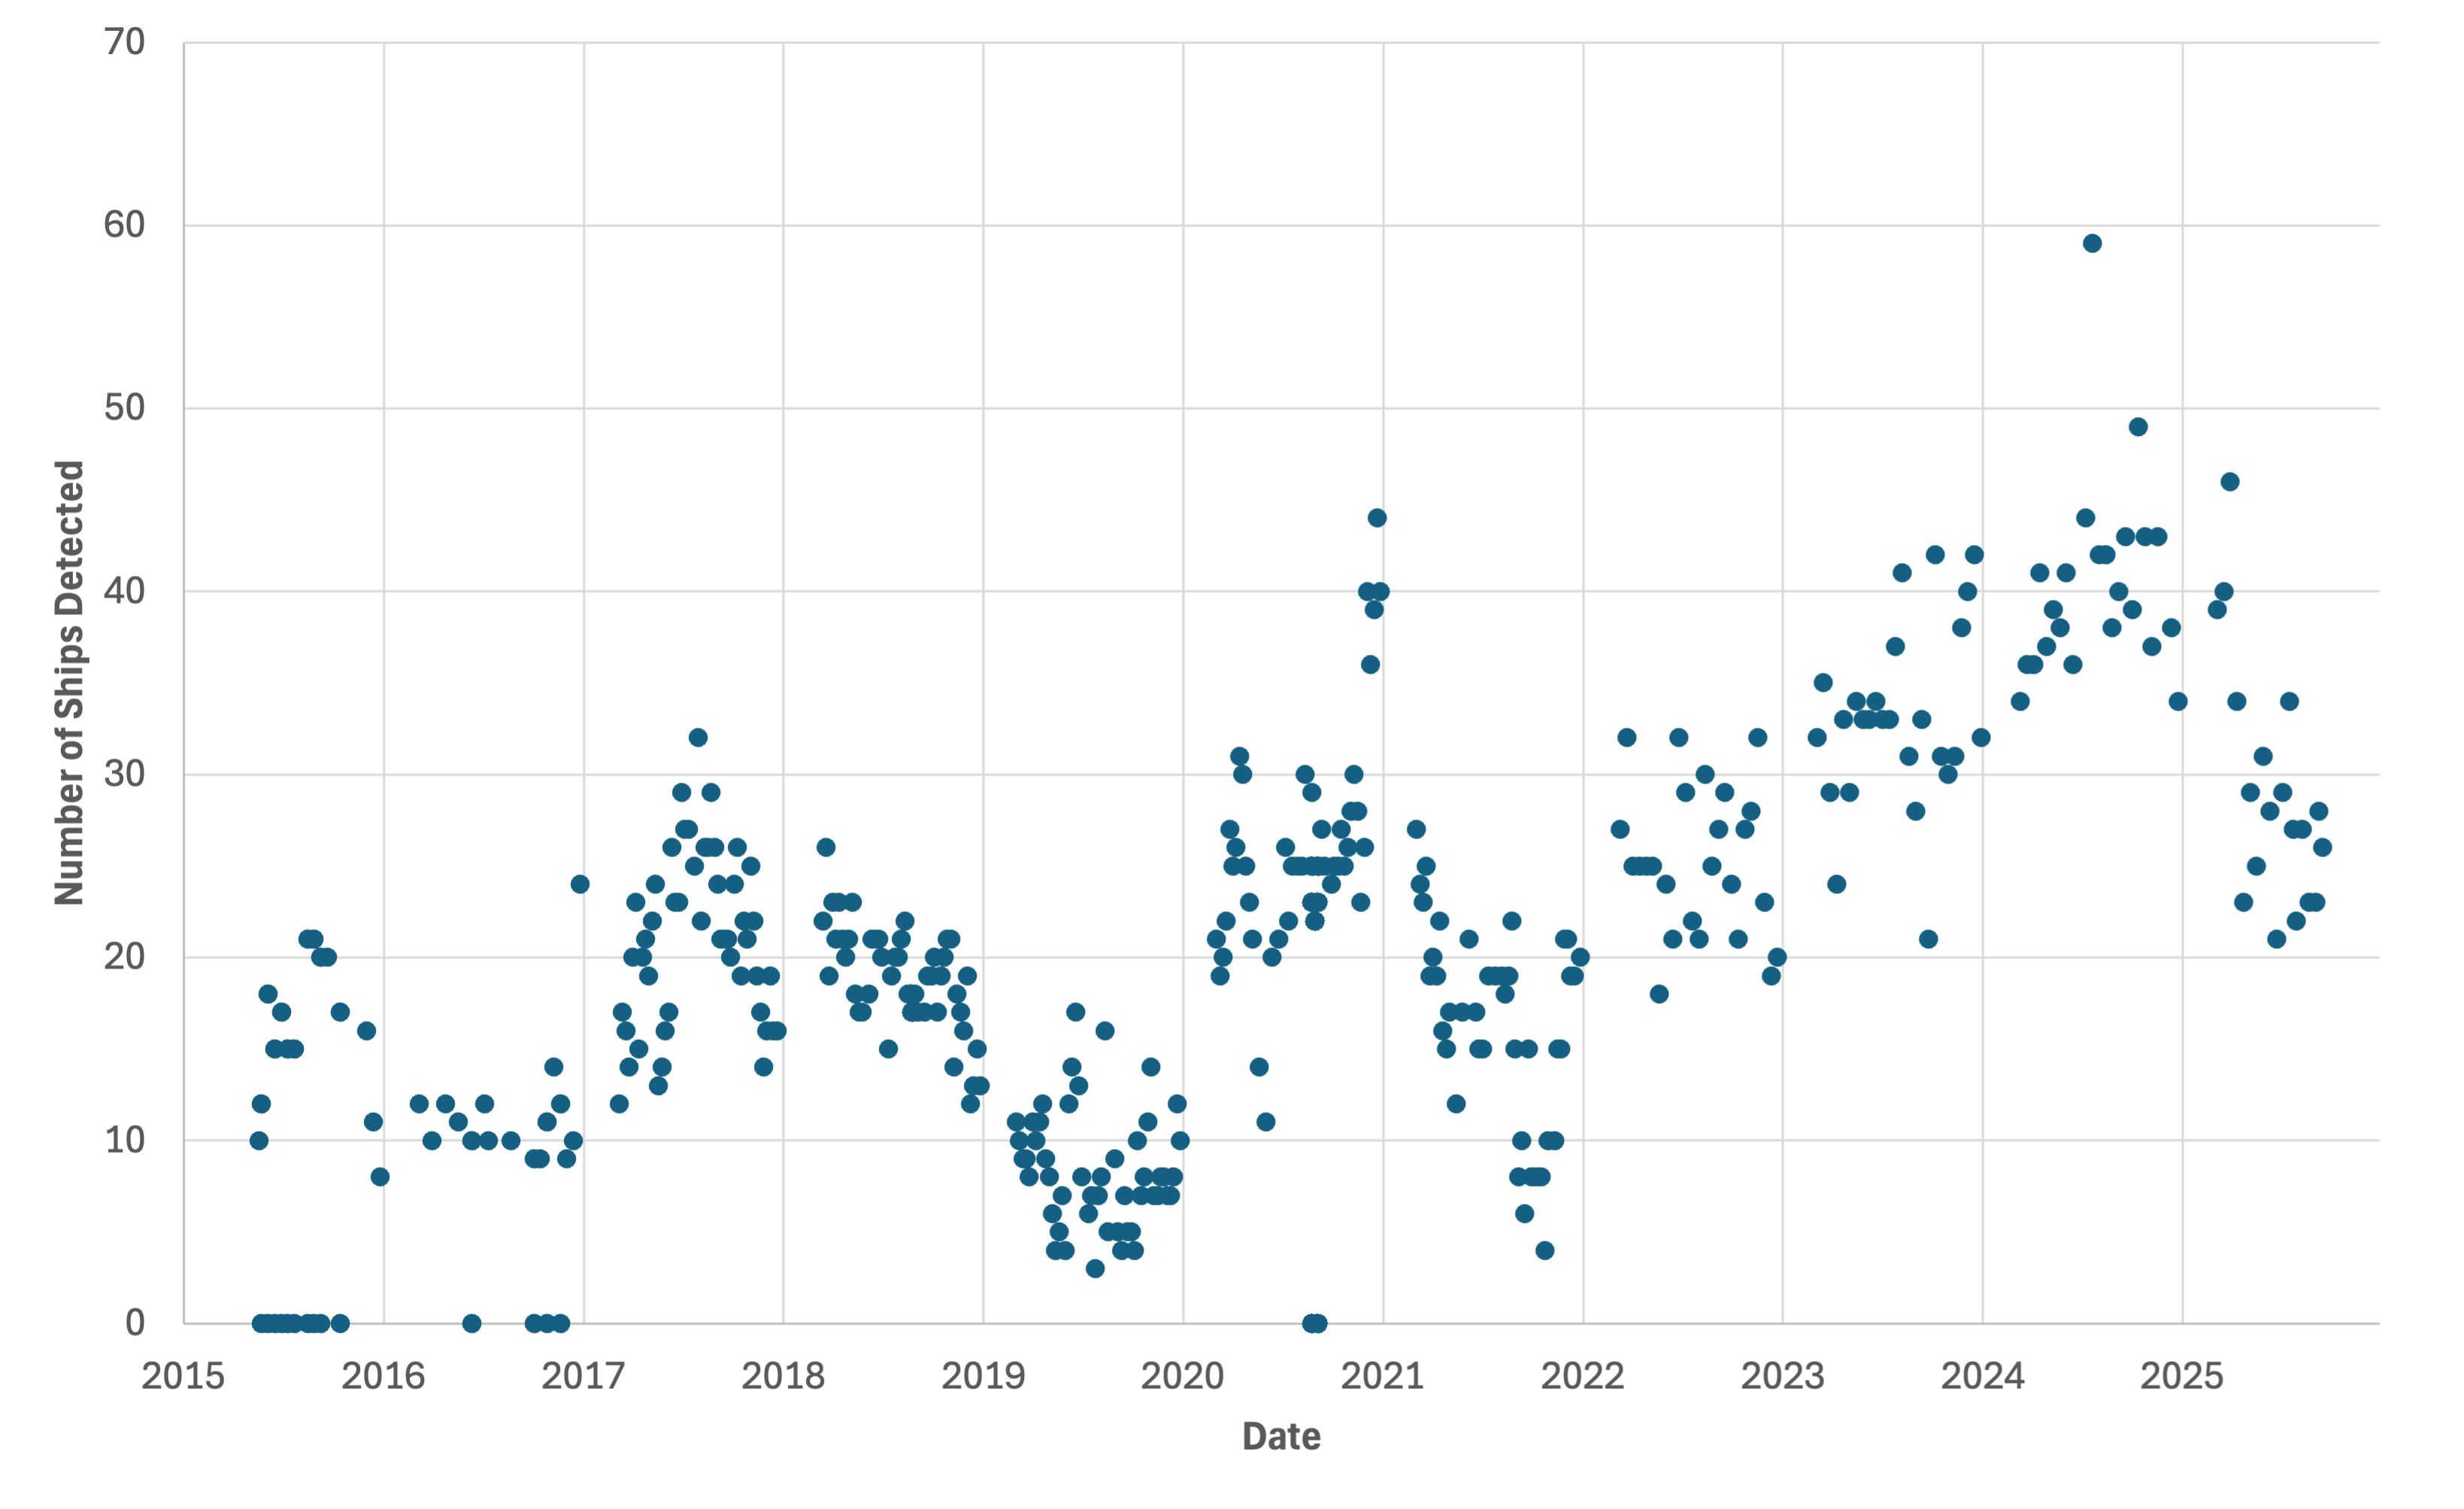
The overall increase in activity at Nampo Port was further dissected using the polygons bounding the specific areas proximal to both the POL storage area and terminal, and the bulk and container terminals. While activity across both areas followed a generally similar pattern to the port as a whole, the bulk and container terminals showed a more steady, gradual increase in activity from 2015-2025, with transitory drops in activity in 2019 and 2021. The POL storage area and terminal, on the other hand, showed limited increases in activity from 2015-2020, a sharp decrease in activity from 2021-2023, and a rapid and continuous increase in activity from 2023-2025, with current large vessel counts up over 350% compared to pre-2020 levels.

In combination with qualitative analysis of infrastructure upgrades and expansions at the site, especially in the POL area, this data serves as valuable quantitative evidence of increasing exchange of POL, bulk, and containerized goods at Nampo Port

